

1.3 - Estimating Limit Values from Graphs
Introduction to One-Sided Limits
So far we’ve looked at limits from both directions at once. Now we’ll look at one-sided limits, where we approach an -value from only one direction, either the left or the right.
A one-sided limit still describes the -value a function approaches as approaches a given value. We just restrict which side we come from.
Notation
Left-hand limit (approaching from the left)
- The minus sign means we’re approaching from the left side
- We move toward from values less than
- Think: moving in the positive direction along the -axis toward
Right-hand limit (approaching from the right)
- The plus sign means we’re approaching from the right side
- We move toward from values greater than
- Think: moving in the negative direction along the -axis toward
Example: When One-Sided Limits Differ
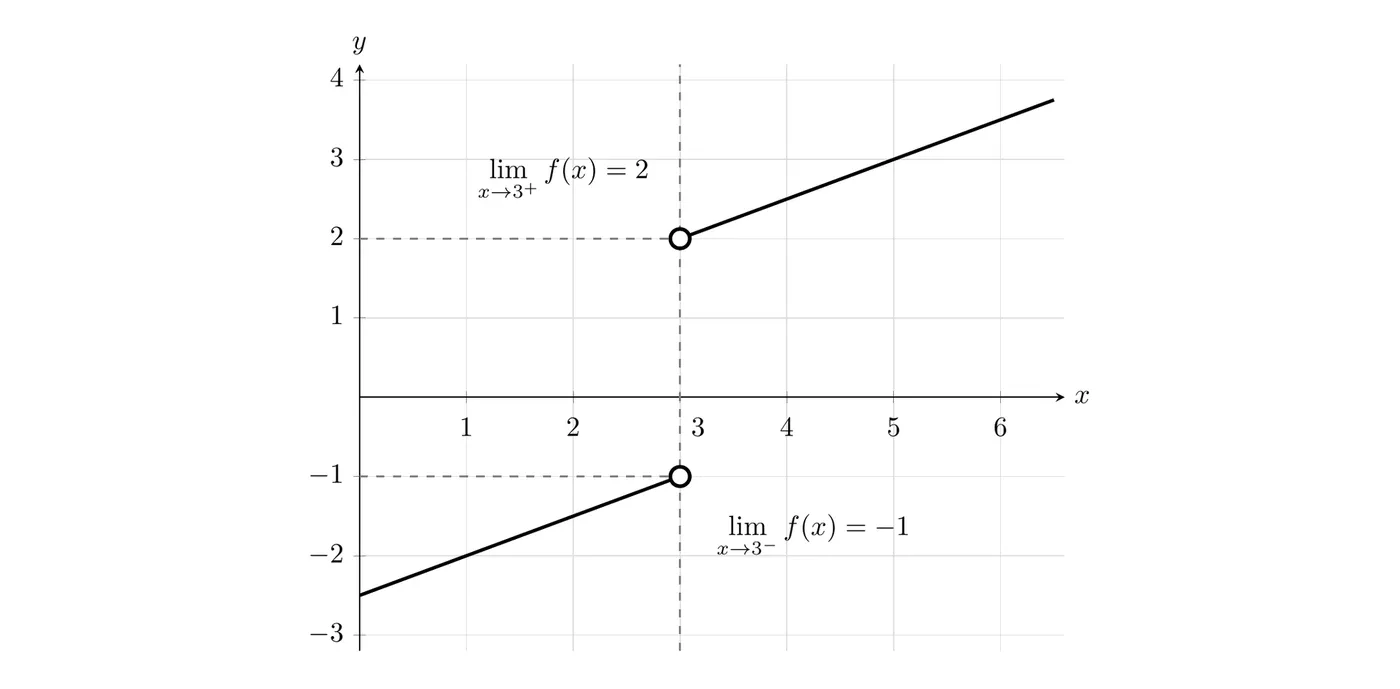
Left-hand limit:
As we approach from the left (traveling along the curve from ), the -values head toward .
Right-hand limit:
As we approach from the right (from ), the -values head toward .
Two-sided limit:
Since the left-hand and right-hand limits are different, the two-sided limit does not exist. For a two-sided limit to exist, both one-sided limits have to approach the same value.
The Rule for Two-Sided Limits
In other words, the two-sided limit exists only when both one-sided limits exist and agree.
Three Ways a Limit Can Fail to Exist
A two-sided limit exists only when heads toward one real number from both sides. There are three common ways that breaks down:
- The one-sided limits disagree. This is the example above: the left side heads to and the right side heads to . You’ll usually see this at a jump in the graph.
- The function is unbounded. As , grows without bound from both sides. It isn’t approaching any real number, so the limit does not exist. (We write to describe how it fails. More on this in 1.14.)
- The function oscillates. As , keeps swinging between and , faster and faster. It hits at and at , and those points pile up right next to . It never settles on one value, so the limit does not exist.
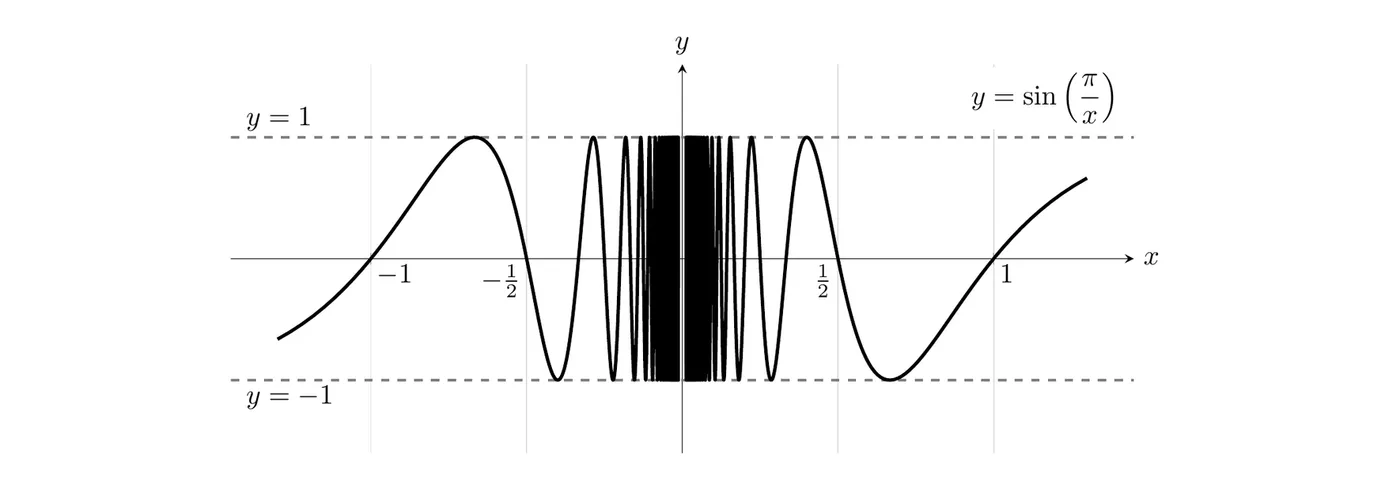
Watch the scale. A graph only shows what fits in its window, so it can hide important behavior. A calculator graph of usually looks like the plain line , because the hole at is a single missing point. And no screen can draw accurately near . If a graph looks suspicious, zoom in, or check with a table or the algebra.
Practice Problems
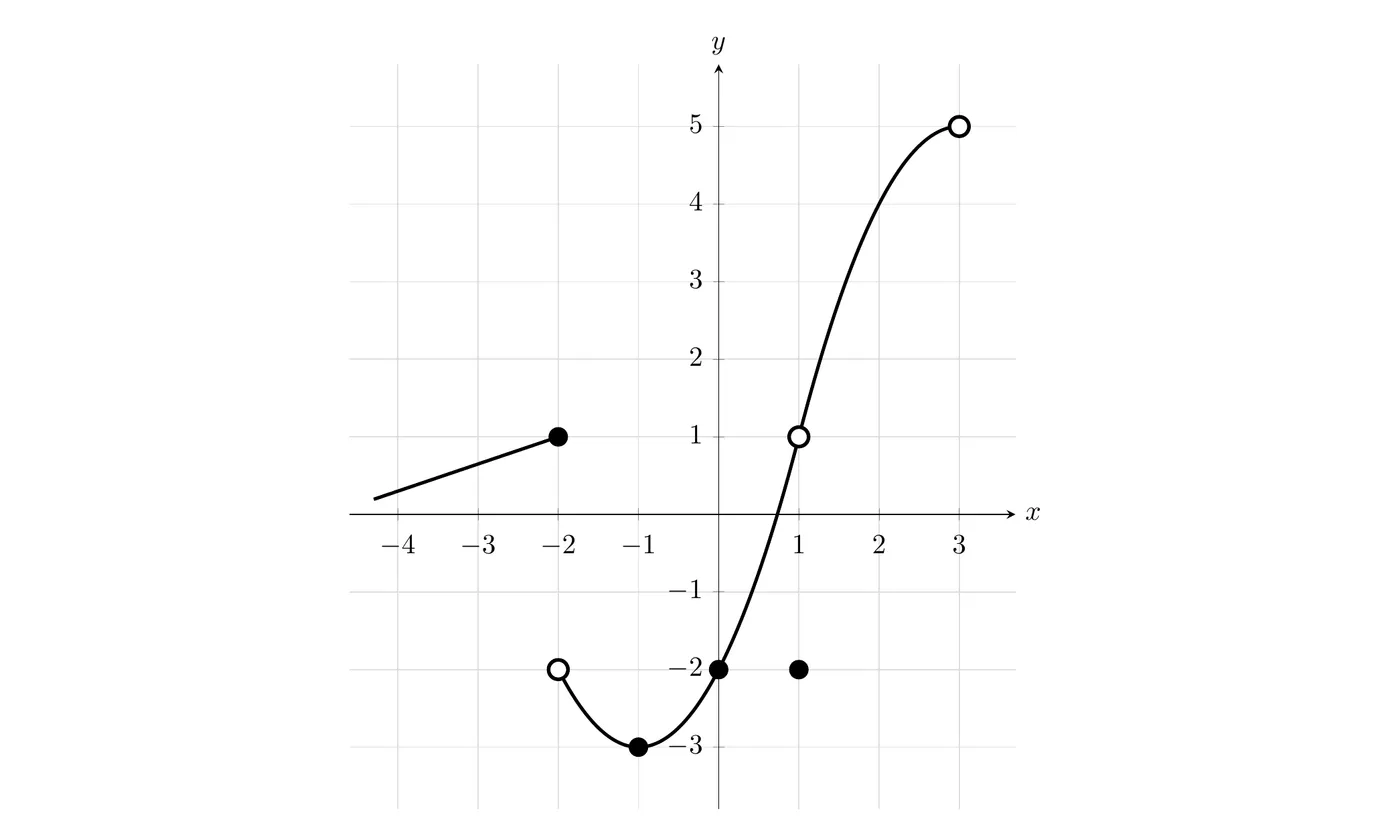
Find each of the following:
a) b) c) d) e) f) g) h)
Solutions
a) . Find , approach from the left (values less than ), and follow the curve. It approaches .
b) . Start from the right side of and follow the curve back toward it. The curve approaches .
c) . The left-hand limit is and the right-hand limit is . Since , the two-sided limit doesn’t exist.
d) . Both sides converge to (at the open circle). Even though there’s a hole at and the filled dot sits at , the limit is still .
e) . Both sides meet at the same point, .
f) . Approaching from the left only, the curve rises to .
g) . Both directions approach .
h) . Find the filled dot at . It’s at (ignore the open circle).
Constructing a Graph from Given Conditions
Sometimes you’ll need to sketch a function that satisfies a list of conditions involving one-sided limits, two-sided limits, and function values.
Problem: sketch a graph of satisfying all of the following:
- is increasing on the interval
Step 1: plot
At , put a filled dot at .
Step 2: apply
As approaches 4 from both sides, the function approaches . Put an open circle at . The graph has to approach this point from both left and right.
Step 3: apply
From the right side of , the function approaches . So we need an open circle (or some indication) at where the graph comes in from the right.
Step 4: increasing on
Between and , the graph has to always be rising left to right. This connects the point approaching from the right to the point approaching from the left. Draw a smooth curve that steadily increases, starting near and ending near .
Step 5: apply
The left-hand limit at has to be greater than the right-hand limit.
We know , so .
From the left side of , the graph must approach a -value above 2. Say it approaches . Mark and draw the graph coming in from the left.
Final graph
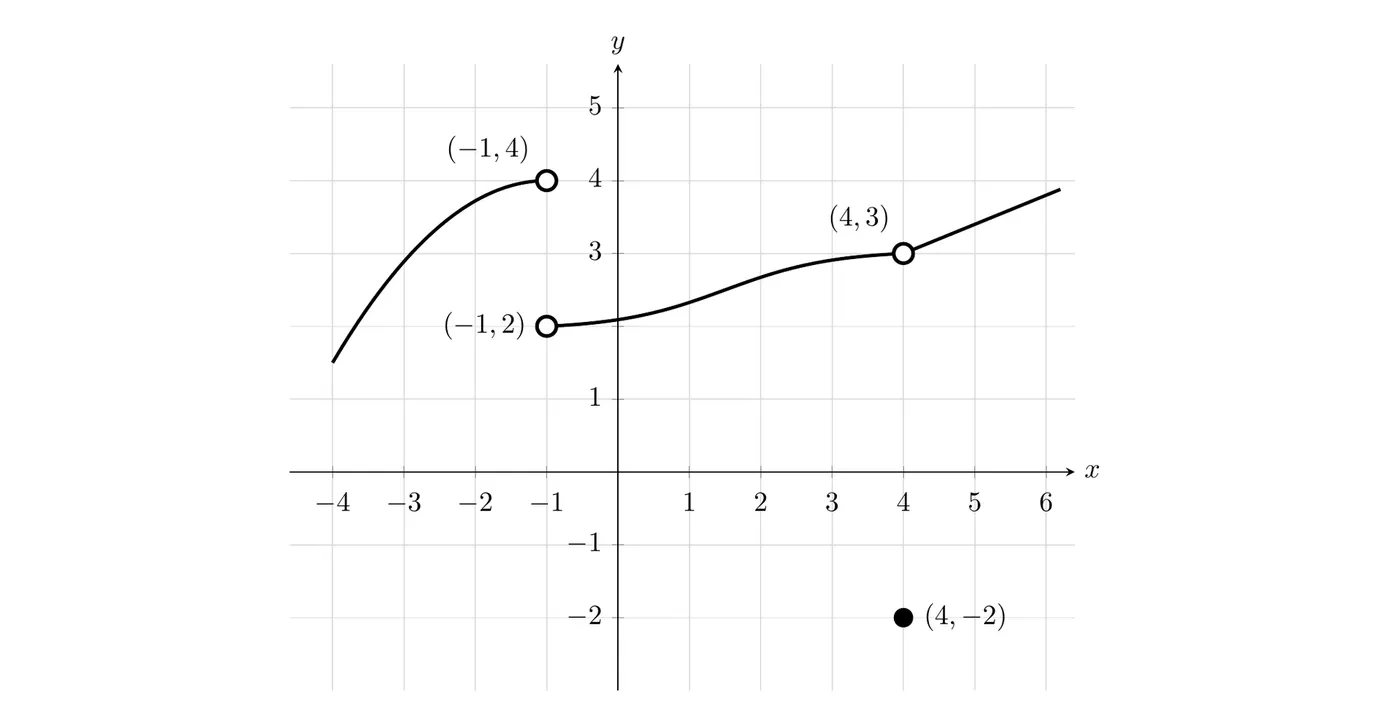
Verification
- Condition 1: , filled dot at ✓
- Condition 2: , both sides approach ✓
- Condition 3: , right side approaches ✓
- Condition 4: increasing on , the graph rises throughout ✓
- Condition 5: left approaches , right approaches , and ✓
Key Takeaways
- One-sided limits look at behavior from only one direction, left or right
- Notation: is from the left, is from the right
- The two-sided limit exists if and only if both one-sided limits exist and are equal
- When one-sided limits differ, the two-sided limit does not exist (DNE)
- A limit also does not exist when the function is unbounded or oscillates without settling on one value
- Graphs can hide behavior (like a one-point hole), so zoom in or check a table when something looks off
- Open circles and filled dots tell you about function values, not limits
- Limits describe approaching behavior, which may differ from actual function values
- When constructing graphs from conditions, work through each requirement in order and verify at the end