

1.1 - Change in Tandem
Overview
A function connects two quantities, so when one changes, the other changes with it. This topic is about describing that connection: what a function is, how to read one in any form (a graph, a table, an equation, or words), and how to describe the way its outputs change as its inputs increase. You'll use these words and ideas in every unit of AP Precalculus.
What a function is
A function is a rule that maps each input value to exactly one output value. You put in an input, and the rule gives back one output, never two.
- Domain: the set of all input values the function accepts.
- Range: the set of all output values the function produces.
- Independent variable: the variable for the inputs (usually , or for time). You choose its value.
- Dependent variable: the variable for the outputs (usually or ). Its value depends on the input.
In function notation, means that when the input is , the output is . The input goes inside the parentheses, and the whole expression is an output value.
One input can't have two outputs, but two different inputs can share an output. For example, gives and , and that's fine. On a graph, this means no vertical line crosses the graph more than once (the vertical line test).
When two functions are equal
Two functions and are equal when they have the same domain and give the same output for every input in that domain, so for every . Both parts matter.
Example 1: Are these functions equal?
Are and equal?
Step 1: Simplify where you can.
Step 2: Compare the domains. The domain of is all real numbers. But is undefined, so is not in the domain of .
Answer: The outputs match for every , but the domains are different, so and are not equal. Their graphs look the same, except the graph of has a hole at .
Four ways to represent a function
The input and output values of a function vary in tandem: they change together according to the function rule. AP Precalculus expects you to work with that rule in four forms. Here is one function written all four ways:
Representation | What it looks like | Example |
Verbal | Words | The output is more than twice the input. |
Analytical | An equation | |
Numerical | A table of values | , , |
Graphical | A graph | A line through with slope |
Each form shows something the others hide. A graph shows the overall shape at a glance, a table gives exact values at a few inputs, an equation lets you compute any output, and words connect the function to a real situation. On the exam, you'll often get one form and need to build or read another.
Image and preimage
The image of an input value is the single output the rule gives for it. The preimage of an output value is the set of all inputs that give that output. An image is always one value. A preimage can have one value, several values, or none at all.
Example 2: Finding images and preimages
Let . Find the image of , and the preimages of , , and .
Image of 5: plug in .
The image of is .
Preimage of 3: solve .
So or . The preimage of is , two inputs.
Preimage of -1: solve .
So the preimage of is , just one input.
Preimage of -5: solve .
The discriminant is , which is negative, so no real input works. The preimage of is empty, which tells you is not in the range of .
Increasing and decreasing
A function is increasing on an interval if its outputs always go up as its inputs go up. In symbols: for all and in the interval, if , then .
A function is decreasing on an interval if its outputs always go down as its inputs go up: for all and in the interval, if , then .
Read a graph from left to right, the direction the inputs increase. Uphill means increasing, and downhill means decreasing.
Exam note: the AP exam doesn't test whether an endpoint belongs in an interval where a function is increasing or decreasing. So for describing where a function increases or decreases, either or is fine.
On free-response questions, name both the input and the output when you describe change, like this: "On the interval , as the value of increases, the value of decreases."
Concavity: How the rate of change behaves
Increasing and decreasing tell you which way the outputs move. Concavity tells you how the rate of change is behaving.
- Concave up: the graph is concave up on intervals where the rate of change is increasing. It bends upward, like a cup.
- Concave down: the graph is concave down on intervals where the rate of change is decreasing. It bends downward, like a cap.
Direction and concavity are separate ideas, so all four combinations are possible:
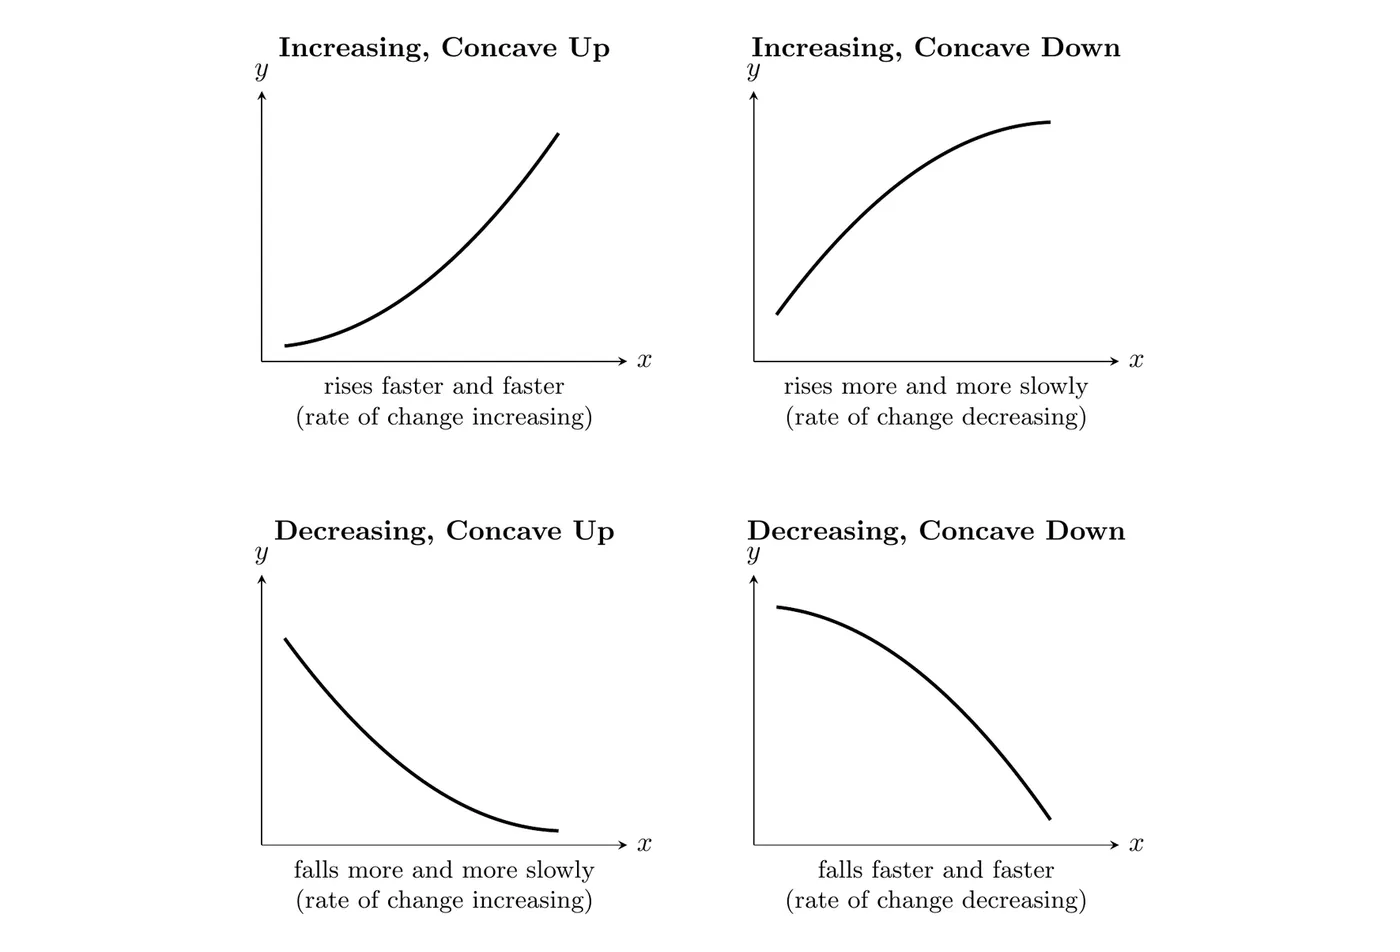
The bottom row is where students slip. A graph that is decreasing and concave up is falling, but more and more slowly: its rate of change is negative and getting closer to , so the rate is increasing. A graph that is decreasing and concave down is falling faster and faster: its rate is negative and getting more negative.
A point where a graph switches concavity is called a point of inflection. You'll study these in Topic 1.4.
Zeros of a function
A zero of a function is an input value where the output is . On a graph, that's where the graph meets the -axis, since every point on the -axis has a -value of .
Watch the wording: if , then is a zero (a number), and the point is an -intercept.
Describing a graph
Every point on the graph of is an input-output pair, with . Because a graph shows all of those pairs at once, you can see how the outputs change as the inputs increase, which is exactly what AP questions ask you to describe.
Example 3: Reading a graph (AP-style)
The graph of is shown. (a) Find the zeros of . (b) On what intervals is increasing? Decreasing? (c) On what intervals is the graph of concave up? Concave down? (d) Describe how the values of change on the interval .
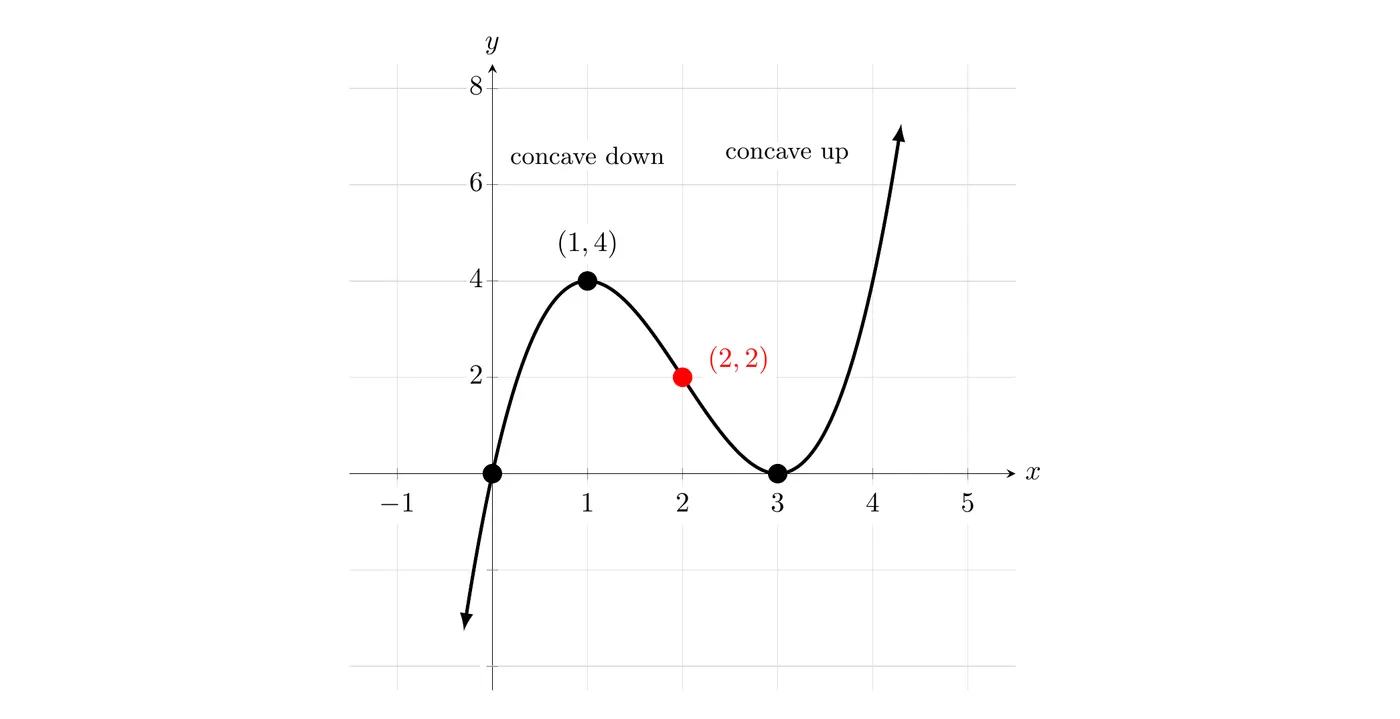
(a) Zeros. The graph meets the -axis at and . Check: and .
(b) Increasing and decreasing. Reading left to right, the graph rises to the peak at , falls to , then rises again. So is increasing on and , and decreasing on .
(c) Concavity. The graph bends downward to the left of and upward to the right of it. So the graph is concave down on and concave up on .
(d) In words: on the interval , as increases, decreases. It decreases faster and faster from to , where the graph is concave down, then more and more slowly from to , where the graph is concave up.
Building a graph from a description
A verbal description of how two quantities change together is enough to sketch a graph, even with no numbers. Ask two questions: is the output going up or down, and is it changing faster or slower as the input increases?
Example 4: Filling a flask
Water is poured at a constant rate into a flask that is wide at the bottom and narrow at the top. Sketch the height of the water as a function of time.
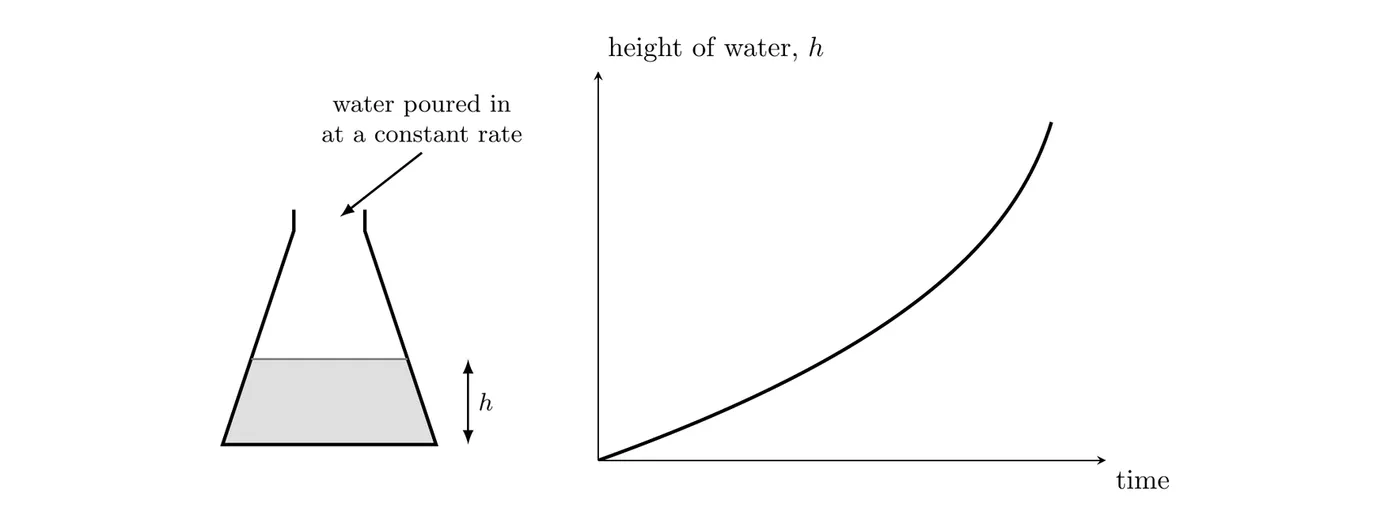
Is the height increasing or decreasing? Water keeps coming in, so the height always increases.
Is it rising faster or slower? The same amount of water goes in every second. Near the bottom, the flask is wide, so the water spreads out and the height rises slowly. Higher up, the flask is narrow, so the same amount of water stacks up higher and the height rises faster.
Answer: the height increases at an increasing rate, so the graph is increasing and concave up.
If the flask were narrow at the bottom and wide at the top, the height would rise quickly at first and then more slowly, so its graph would be increasing and concave down.
Common mistakes
- Reading a graph right to left. Increasing and decreasing describe what happens as the input increases, so always read left to right.
- Mixing up a zero and an intercept. A zero is an input value like . The -intercept is the point .
- Ignoring the domain when comparing functions. Equal functions need the same domain, not just formulas that match after simplifying.
- Thinking concave up means increasing. A concave up graph can be decreasing. Concavity is about whether the rate of change is increasing, not whether the outputs are.
- Calling a preimage a single number. A preimage is a set of inputs. It can have several values, one, or none.