

1.13 - Function Model Selection and Assumption Articulation
Overview
Before you can build a model, you have to decide what kind of function fits. This topic is about reading a data set or a description and picking a function type (linear, quadratic, cubic, a higher-degree polynomial, or piecewise), then stating the assumptions and restrictions that come with that choice. On the AP exam, you need to justify your choice, not just name it.
Choosing a function type
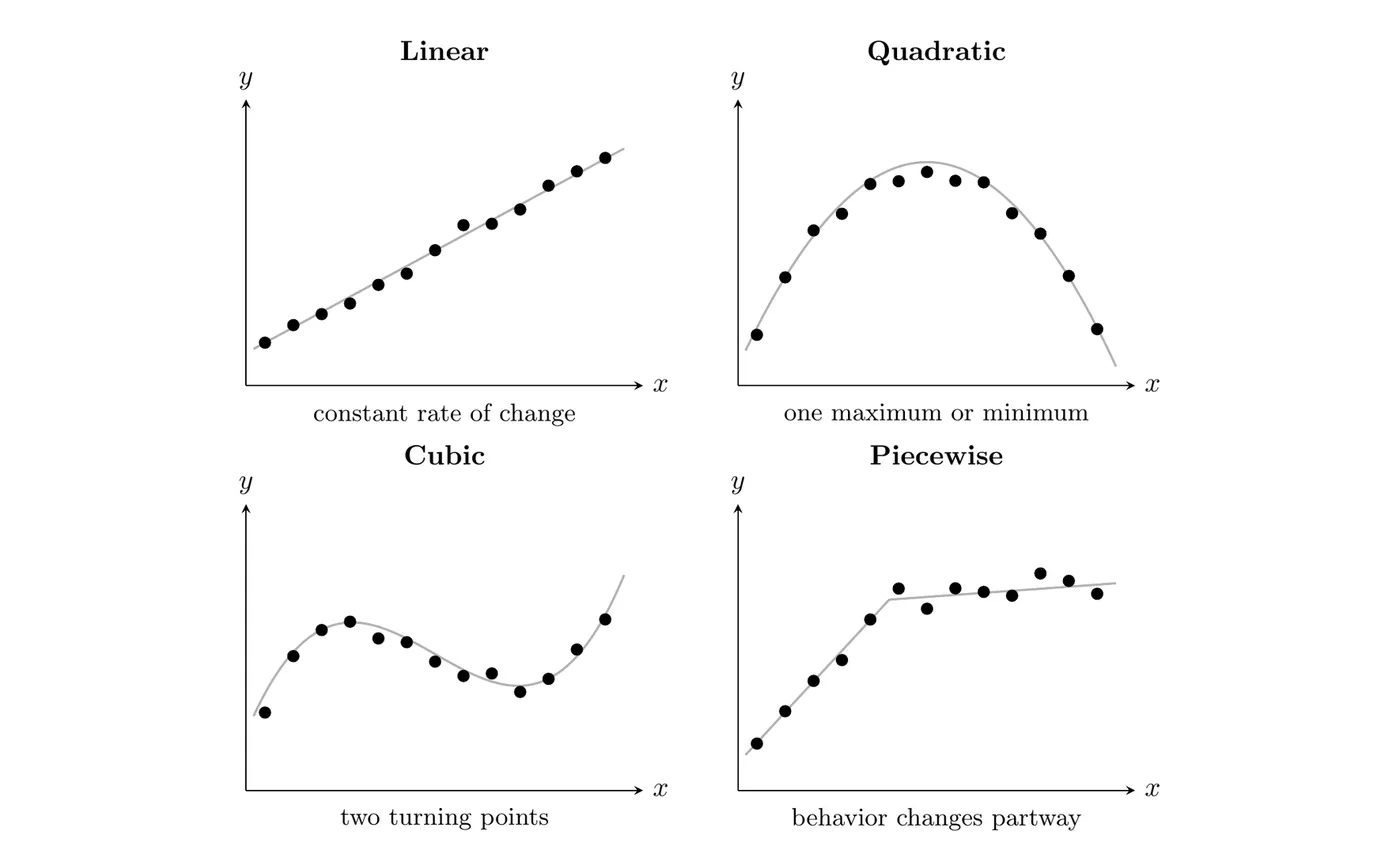
The biggest clue is how the output changes as the input changes. The figure shows what data typically looks like for each type.
Linear functions
Linear functions model data or situations with a roughly constant rate of change. Each time the input goes up by the same amount, the output goes up (or down) by about the same amount. Examples: a car driving at a steady speed, or a phone plan that charges the same price for each gigabyte.
Quadratic functions
Quadratic functions model data or situations whose rates of change are roughly linear, meaning the rate of change itself goes up or down by about the same amount each step. They also fit data that's roughly symmetric with a single maximum or minimum, like the height of a thrown ball over time.
Geometric contexts
Area and volume problems tell you the function type:
- Area (two dimensions) multiplies two lengths. If both lengths depend on , the area is usually quadratic.
- Volume (three dimensions) multiplies three lengths. If all three depend on , the volume is usually cubic.
For example, a rectangular pen built against a wall, with 100 feet of fence for the other three sides and width (the two sides perpendicular to the wall), has area , which is quadratic. An open box made by cutting squares of side from the corners of a 20 inch by 30 inch sheet and folding up the sides has volume
which is cubic.
Higher-degree polynomials
Polynomial functions model data or situations with several real zeros or several maximums and minimums. A polynomial of degree has at most real zeros and at most turning points, so counting turning points tells you the smallest degree that can work:
What the data shows | Smallest degree that fits |
One turning point | 2 (quadratic) |
Two turning points | 3 (cubic) |
Three turning points | 4 (quartic) |
Piecewise-defined functions
A piecewise-defined function is a set of functions, each used on its own interval of the domain, with intervals that don't overlap. Use one when the data or situation behaves differently on different intervals. Examples: a data plan with a flat fee up to a limit and a price per gigabyte after that, tax brackets, or a car that speeds up, cruises, and then slows down.
Using differences to pick a degree
When the inputs are equally spaced, you can test the outputs by subtracting each value from the next one. These are the first differences. Subtracting consecutive first differences gives the second differences, and so on.
A polynomial function of degree models data with roughly constant, nonzero th differences:
Roughly constant | Function type |
First differences | Linear (degree 1) |
Second differences | Quadratic (degree 2) |
Third differences | Cubic (degree 3) |
Real data almost never has perfectly constant differences, so look for differences that are close to constant.
Example 1: Second differences
Which type of function best models this data?
0 | 1 | 2 | 3 | 4 | 5 | |
3 | 7 | 15 | 27 | 43 | 63 |
Step 1: The inputs go up by 1 each time, so differences work here.
Step 2: First differences: , then , , , . These aren't constant, so the data isn't linear.
Step 3: Second differences: , then , , . These are constant and nonzero.
Answer: A quadratic function. The second differences are constant, which means the rate of change (the first differences) goes up by the same amount each step, so the rates of change are linear.
Example 2: Third differences in a volume table
The table gives the volume , in cubic inches, of the open box from earlier on this page when squares of side inches are cut from the corners. Which type of function best models these values?
1 | 2 | 3 | 4 | 5 | 6 | |
504 | 832 | 1,008 | 1,056 | 1,000 | 864 |
First differences: . Not constant.
Second differences: . Still not constant.
Third differences: . Constant and nonzero.
Answer: A cubic function. That matches the geometry: volume multiplies three lengths that each depend on . (Topic 1.5 uses the same test to find the degree of a polynomial from a table.)
Fitting a set of points exactly
Two points with different -values always lie on exactly one line. Three such points always lie on a quadratic (or on a line, if they happen to line up). In general, a polynomial function of degree or less can model a graph of points with distinct input values.
- 2 points: degree 1 or less
- 3 points: degree 2 or less
- 4 points: degree 3 or less
This is handy when a problem gives a few exact points, like the two bases and the top of an arch. It doesn't mean a high-degree polynomial is the best model for a big data set, though. A good model follows the overall pattern instead of hitting every single point.
Assumptions behind a model
Every model simplifies the real situation. When you choose or build one, you should be able to say what it assumes.
- What stays consistent. A linear model of a phone battery assumes it drains at the same rate the whole time. A quadratic model of a thrown ball assumes gravity is the only force acting on it, with no air resistance.
- How the quantities change together. A linear cost model assumes each extra item adds the same cost. An area model assumes the area grows with the square of a length. An inverse square model assumes that doubling the distance cuts the effect to one fourth.
On the AP exam, an assumption has to be specific to the context. “The model is accurate” doesn't count. “The rate at which the number of visitors changes decreases by about the same amount every two hours” does.
Restrictions on domain and range
A formula might work for every real number, but the context usually doesn't.
- Domain restrictions come from mathematical clues (no dividing by zero), contextual clues (time can't be negative, a length has to be positive), or the extreme values in the data (don't trust a model far outside the inputs you collected). For the open box, , because cutting 10 inches from each end of the 20 inch side leaves nothing to fold up.
- Range restrictions come from the same kinds of clues. Counts of people or cars must be whole numbers, so you round. Many quantities can't be negative. Some have a maximum, like the number of seats in a stadium.
Example 3: Choosing and justifying a model (AP-style)
A city park counts its visitors every two hours, starting when it opens at 8 AM. Let be the number of hours after 8 AM and be the number of visitors. The park closes at 6 PM.
(hours) | 0 | 2 | 4 | 6 | 8 | 10 |
(visitors) | 15 | 64 | 96 | 104 | 94 | 66 |
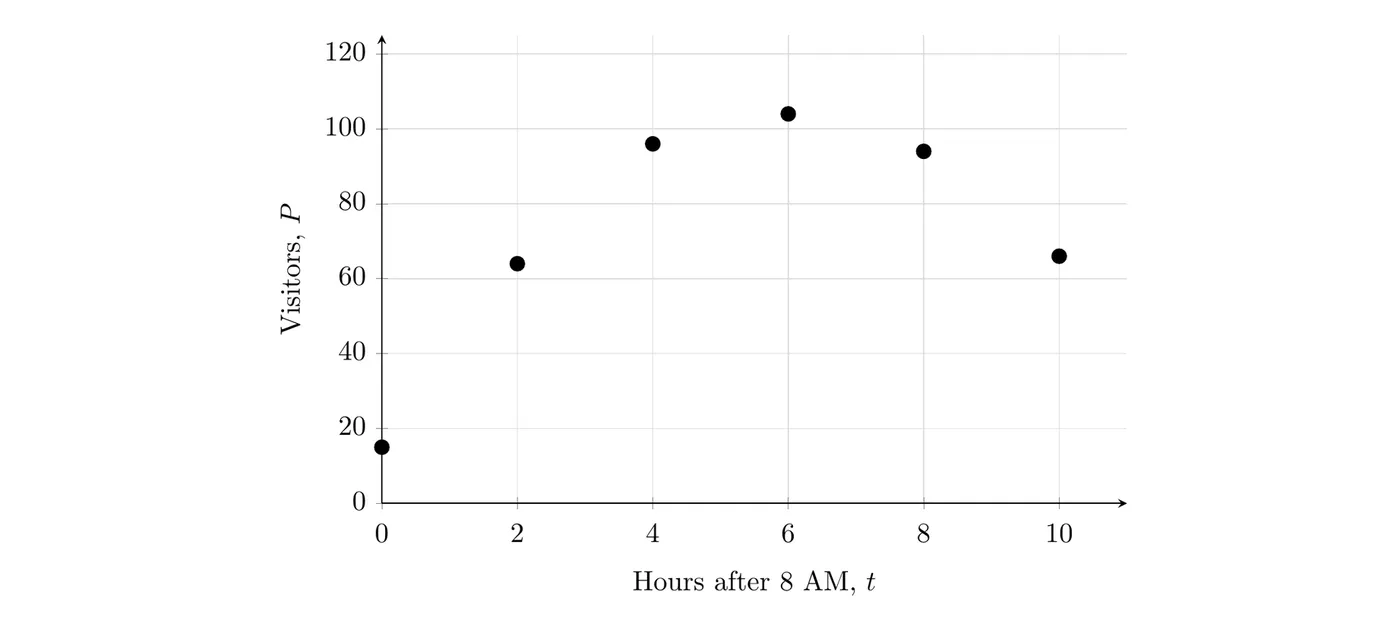
(a) Which type of function best models the data? Justify your answer.
The inputs are equally spaced (every 2 hours). The first differences are , and the second differences are . The second differences are roughly constant (all close to ), so the rates of change are roughly linear. The data also rises to a single maximum and then falls in a roughly symmetric way. A quadratic model is the best choice.
(b) State an assumption of the quadratic model.
The model assumes that the rate at which the number of visitors changes decreases by about the same amount every two hours. That means nothing unusual, like a concert or a storm, suddenly changes attendance during the day.
(c) What domain and range restrictions should the model have?
The park is open from 8 AM to 6 PM, so the domain is . The number of visitors has to be a whole number that isn't negative, so outputs should be rounded to whole numbers and can't go below 0.
Common mistakes
- Using differences when the inputs aren't equally spaced. The difference test only works when the -values go up by the same amount each time.
- Expecting perfectly constant differences. Real data is messy. Roughly constant is enough.
- Confusing the rate of change with the output. Data whose rates of change are linear is modeled by a quadratic function, not a linear one.
- Picking a degree that's too low. Data with three turning points needs a polynomial of degree 4 or higher.
- Forgetting restrictions. A model that predicts negative visitors, or a box with a negative side length, is being used outside its domain.
- Writing vague assumptions. Tie every assumption to the context and its quantities.