

1.3 - Rates of Change in Linear and Quadratic Functions
Overview
Average rates of change can tell function types apart. For a linear function, the average rate of change never changes. For a quadratic function, it does change, but at a steady rate. In this topic you'll see why, connect the average rate of change to the slope of a secant line, and use changing rates to decide whether a graph is concave up or concave down.
Average rate of change is the slope of a secant line
A secant line is a line through two points on a graph. The average rate of change of over is the slope of the secant line from to :
So every time you compute an average rate of change, you're finding a slope. For example, here is the secant line for over . Since and :
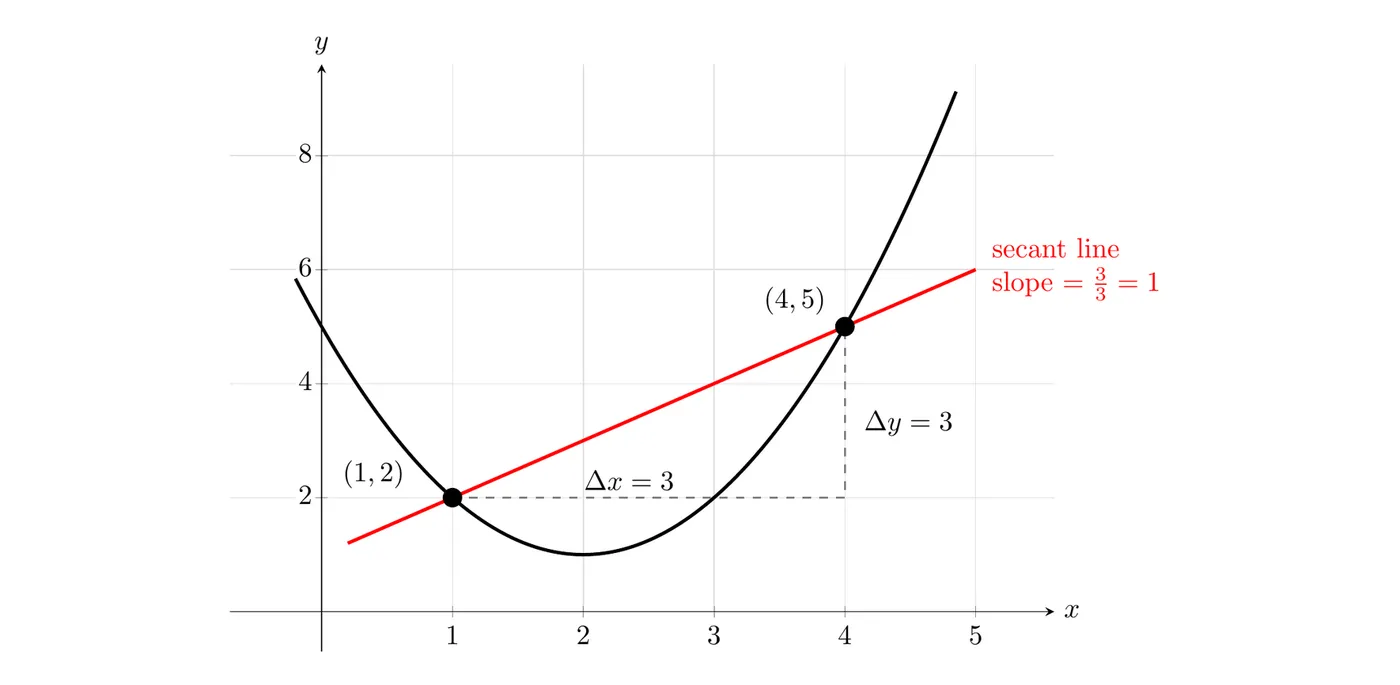
The secant line rises units over a run of units, so its slope, which is the average rate of change of over , is .
Linear functions: A constant rate of change
For a linear function , the average rate of change over any interval, of any length, is the same number :
For example, look at at equally spaced inputs:
Every output drops by , so every average rate of change over these intervals is . Since the average rates of change over consecutive equal-length intervals are constant, they are changing at a rate of zero. That's the signature of a linear function.
Quadratic functions: Rates that change at a constant rate
For a quadratic function, the average rate of change is not constant. But over consecutive equal-length intervals, the average rates of change follow a linear pattern, so they change by the same amount each step.
Example 1: Average rates of change of a quadratic
Let . Find the average rates of change over , , , , and .
The outputs are , , , , , and . Each interval has length :
Interval | Average rate of change | Change from the previous rate |
Each red segment below is a secant line, labeled with its slope:
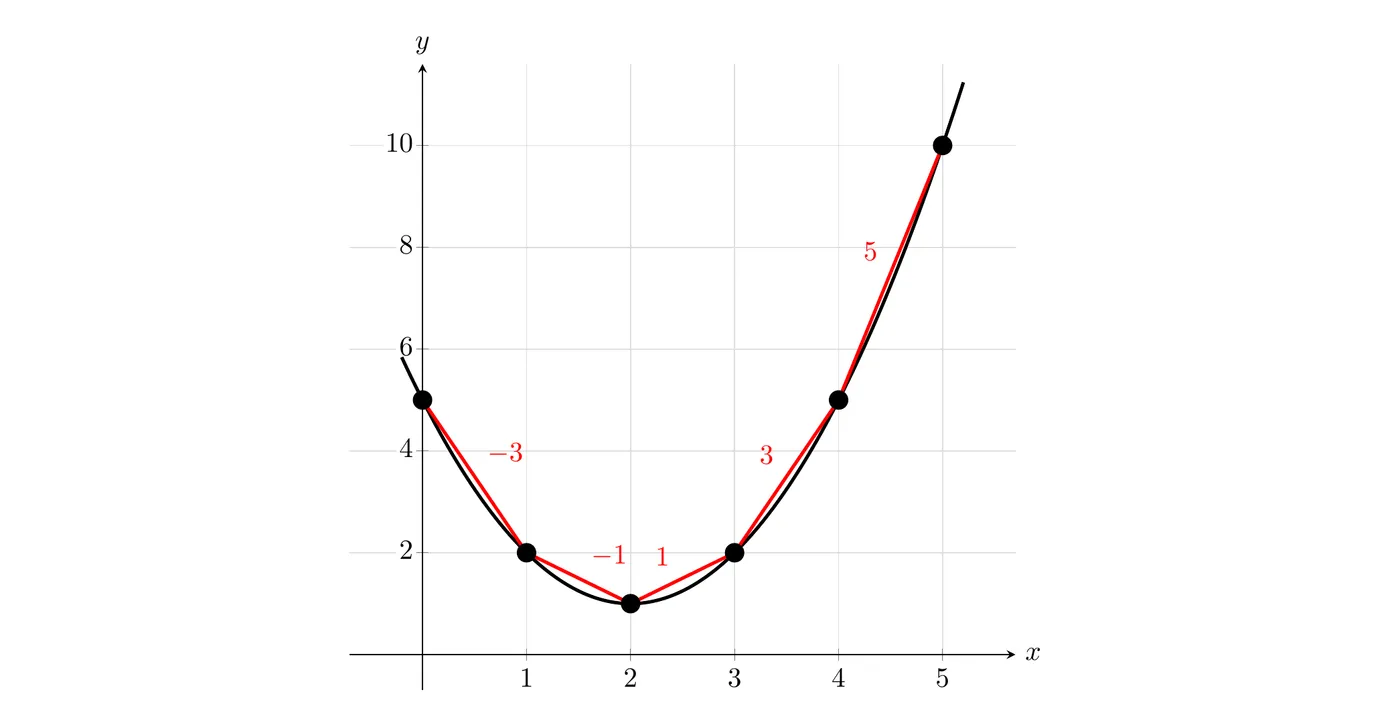
Answer: the average rates of change are . Each is more than the one before, so the average rates of change are changing at a constant rate of per interval. In fact, the average rate of change over is given by the linear function .
Why this works for every quadratic
Take any quadratic and any interval length . The average rate of change from to is:
With fixed, this is a linear function of with slope . Moving to the next interval adds to , so each new average rate of change is more than the last. For with , that's , which matches the table.
Other functions and sequences
For other function types, neither pattern holds. For at , the average rates of change over the unit intervals are . They aren't constant, and they don't change by a constant amount either: the changes are . In Topic 1.5 you'll see that a cubic needs one more round of differences before the pattern turns constant.
A sequence is also a function: its inputs are the term numbers , so the same ideas apply. The average rate of change from term to term is .
- : each term is more than the last, so the average rate of change is a constant per term. That's a linear pattern (you'll call it an arithmetic sequence in Unit 2).
- : the changes are , which go up by each step. That's a quadratic pattern. (These terms are .)
Concavity from average rates of change
Average rates of change over equal-length intervals also reveal concavity:
- If the average rates of change over equal-length intervals are increasing (for all small intervals), the graph is concave up.
- If they are decreasing, the graph is concave down.
This matches Topic 1.1: concave up means the rate of change is increasing. In Example 1, the rates increase, and the parabola opens up. For any quadratic, the rates change by each step, so the graph is concave up everywhere when and concave down everywhere when .
Example 2: A growing plant (AP-style)
The height of a plant, , in centimeters, is measured every weeks. The results are in the table.
(weeks) | |||||
(centimeters) |
(a) Find the average rate of change of over each consecutive interval in the table. (b) Is the graph of concave up or concave down on ? Give a reason. (c) Is a linear model or a quadratic model more appropriate for these data? Give a reason.
(a) Each interval has length , so divide each change in height by :
Interval | Average rate of change (cm per week) |
(b) The average rates of change over consecutive equal-length intervals, centimeters per week, are decreasing. So the graph of is concave down. In context, the plant keeps growing, but more slowly as time goes on.
(c) The average rates of change are not constant, so a linear model doesn't fit. They decrease by exactly from each interval to the next, so they change at a constant rate, which is the pattern of a quadratic function. A quadratic model is more appropriate. (In fact, matches every value in the table.)
Common mistakes
- Using unequal intervals. The linear and quadratic patterns only show up over equal-length intervals. Check the spacing of the inputs before you compare rates.
- Confusing the rates with the change in the rates. For a quadratic, the average rates of change are not constant. The change from one rate to the next is.
- Getting concavity backward with negative rates. Rates of are increasing, so the graph is concave up, even though every rate is negative.
- Forgetting to divide by the interval length. If the inputs go up by , divide each change in output by .