

1.14 - Function Model Construction and Application
Overview
Once you've chosen a function type (Topic 1.13), the next step is to build the model and use it. A model can come from restrictions in the problem, from transformations of a parent function, from a regression on a calculator, or from pieces combined into a piecewise function. Rational functions model quantities that are inversely proportional. Every model exists to answer questions, so every answer needs units and a sentence in context.
Building a model from restrictions
A restriction is a fact the model has to satisfy, like a zero, a maximum, a starting value, or a given point. Choose a form of the function that uses those facts directly, then use one more fact to find the last constant.
- Know the zeros? Use factored form, .
- Know the vertex of a parabola? Use vertex form, , where the vertex is .
- Know a starting value and a constant rate of change ? Use .
Heads-up on the letter : in vertex form, is the -coordinate of the vertex, so is shifted 3 units right. Topic 1.12 wrote horizontal shifts as , where has the opposite sign. Both agree that means 3 units right, so just don't carry the letter from one form to the other.
Example 1: A parabolic arch (AP-style)
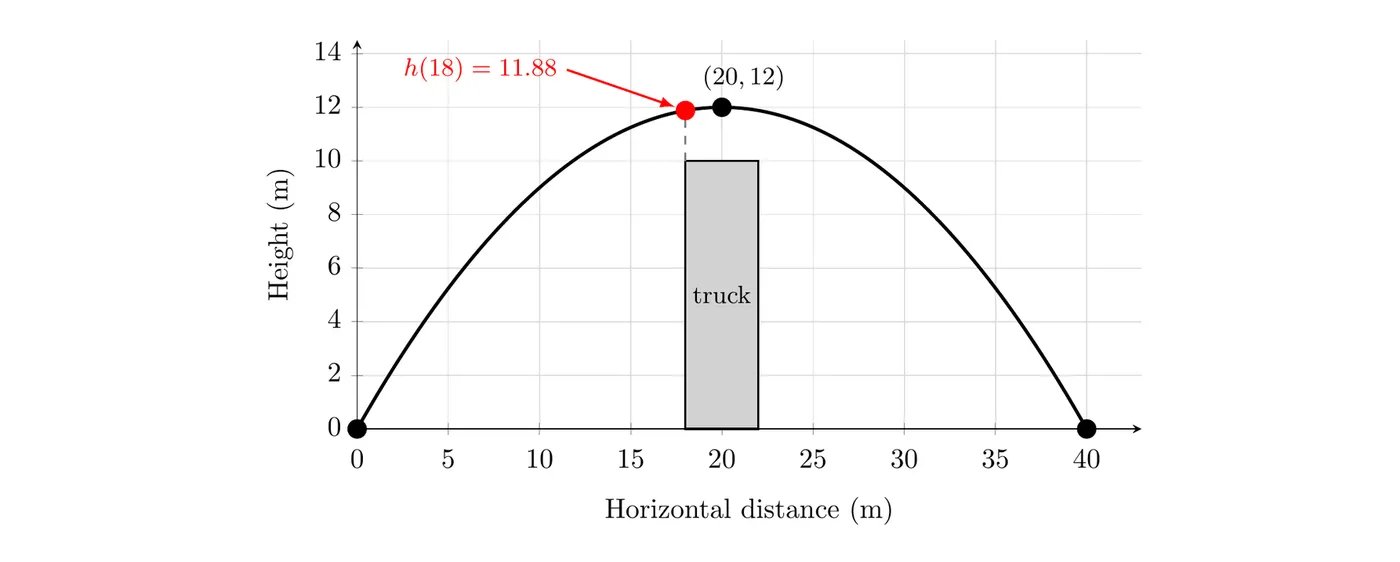
A parabolic arch is 40 meters wide at its base and 12 meters tall at its center. Model the height of the arch, in meters, as a function of the horizontal distance , in meters, from the left base.
Step 1: The arch meets the ground at and , so those are zeros. Use factored form:
Step 2: The top is at the center, , with height 12. Solve for :
(a) How tall is the arch 5 meters from the left base?
The arch is 5.25 meters tall at that spot.
(b) A truck 4 meters wide and 10 meters tall drives through the middle of the arch. Does it fit?
The truck covers . Over the truck, the arch is lowest at the truck's edges, so check :
By symmetry, too. Since , the truck fits, with 1.88 meters to spare at its top corners.
Building a model with transformations
Many models are a parent function that has been translated and dilated. Pick the parent function with the right shape, then use the context to find each transformation.
Example 2: A water fountain
Water leaves a fountain nozzle at ground level. The stream reaches its maximum height of 9 feet at a horizontal distance of 3 feet from the nozzle. Model the height of the stream, in feet, as a function of the horizontal distance , in feet.
Step 1: The stream rises to one maximum and comes back down, so start with the parent function . The parabola opens down, so it's reflected over the -axis, which means the leading coefficient is negative.
Step 2: The maximum is at , so translate the vertex 3 units right and 9 units up:
Step 3: The water starts at the nozzle, the point :
Step 4: The stream lands when , so and (the other solution, , is the nozzle). In context, the domain is and the range is .
In words, the model is the graph of reflected over the -axis, translated 3 units right, and translated 9 units up. Since , there's no stretch or compression.
Building a model with regression
When you have real data, a graphing calculator can find the function of a chosen type that fits it best. This is called a regression. AP Precalculus uses linear, quadratic, cubic, and quartic regressions. You pick the type first, using the reasoning from Topic 1.13, and the calculator finds the coefficients.
On a TI-84:
- Press STAT, choose 1:Edit, and enter the inputs in L1 and the outputs in L2.
- Press STAT, arrow over to CALC, and choose the regression: 4:LinReg(ax+b), 5:QuadReg, 6:CubicReg, or 7:QuartReg.
- Set Xlist to L1 and Ylist to L2. To graph the model too, set Store RegEQ to Y1 (press VARS, then Y-VARS, Function, Y1). Then choose Calculate.
You need at least as many data points as the model has coefficients: 3 for quadratic, 4 for cubic, and 5 for quartic. On the AP exam, give decimal answers correct to three places after the decimal point unless the question says otherwise.
Example 3: A regression model for the park data
The park data from Topic 1.13 is below. Find a quadratic regression model and use it to predict the number of visitors at 1 PM.
(hours after 8 AM) | 0 | 2 | 4 | 6 | 8 | 10 |
(visitors) | 15 | 64 | 96 | 104 | 94 | 66 |
Step 1: Enter in L1 and in L2, then run QuadReg. The calculator gives , , and :
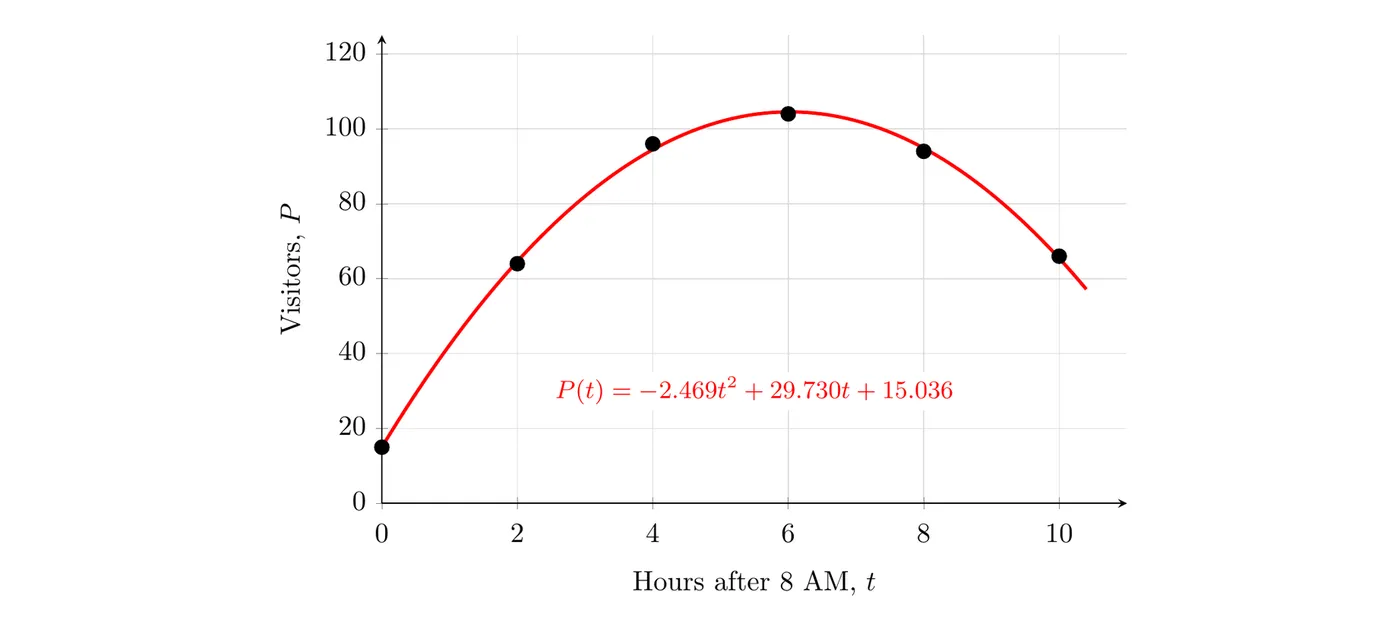
Step 2: 1 PM is 5 hours after 8 AM, so :
(With the unrounded coefficients stored in the calculator, you'd get about .)
Answer: The model predicts about 102 visitors at 1 PM. Visitors are counted in whole numbers, so round.
Piecewise-defined models
A piecewise-defined model combines modeling techniques on different intervals. Build each piece on its own, using restrictions, transformations, or a regression, then check that the pieces fit together where the intervals meet if the real situation has no jumps.
Example 4: A data plan
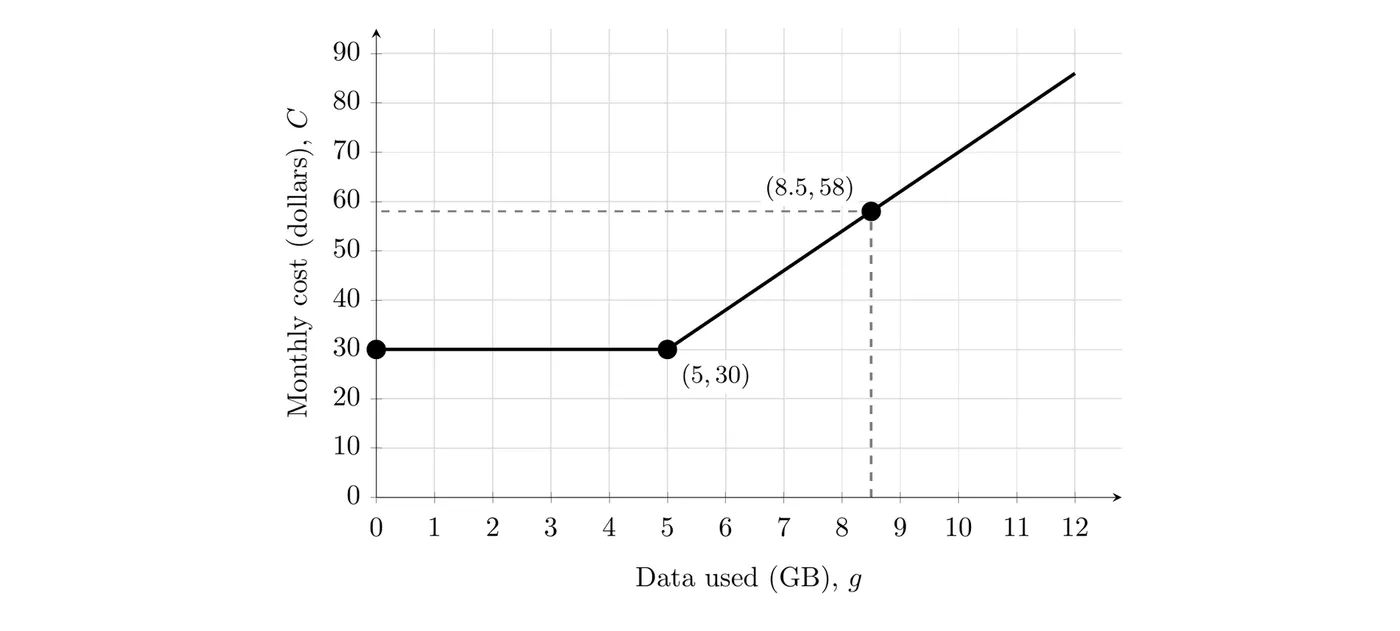
A phone plan costs $30 per month for up to 5 GB of data. Each GB beyond 5 costs $8. Write a model for the monthly cost , in dollars, when GB of data are used, then find the cost of using 8.5 GB.
Step 1: For , the cost doesn't change: .
Step 2: For , the cost starts at $30 and goes up $8 for each GB past 5. That's a line with slope 8, translated 5 units right and 30 units up:
Step 3: Check that the pieces meet. At , the second piece gives , the same as the first piece, so there's no jump.
Step 4: For 8.5 GB, use the second piece:
Answer: Using 8.5 GB costs $58 for the month.
Rational function models
Two quantities are inversely proportional when their product stays constant, so for some constant . When one doubles, the other is cut in half. Data and situations like this are often modeled by rational functions.
A common version is the inverse square relationship, . The gravitational force between two objects and the electric force between two charges are both inversely proportional to the square of the distance between them:
If the distance doubles, the force becomes as strong. If the distance triples, it becomes as strong.
Example 5: Light intensity
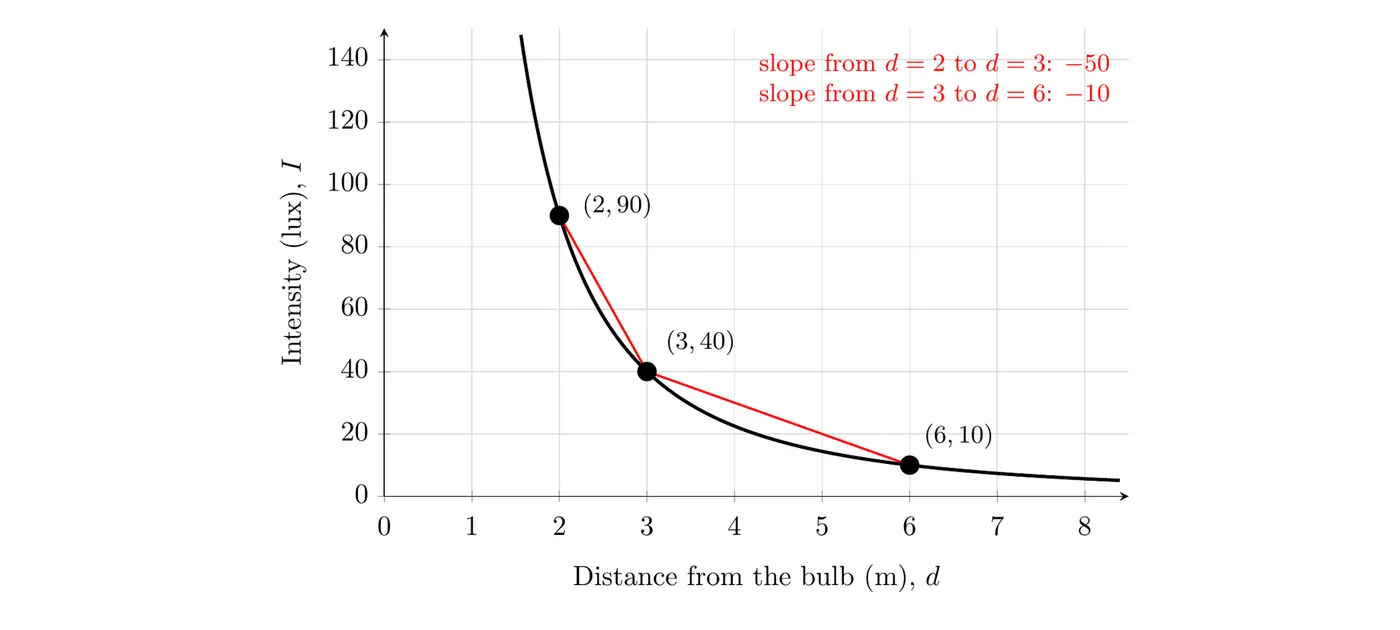
The intensity of light from a bulb is inversely proportional to the square of the distance from the bulb. At 2 meters, the intensity is 90 lux. Build a model, then answer the questions.
Step 1: Write the model and use the given point to find :
(a) What is the intensity at 3 meters? lux.
(b) How far from the bulb is the intensity 10 lux? Solve to get , so meters. (Distance can't be negative, so is thrown out.)
(c) Compare the average rates of change of from to and from to .
Close to the bulb, the intensity drops by an average of 50 lux per meter. Farther away, it drops by only 10 lux per meter on average. The intensity is decreasing, but more and more slowly, so its rate of change is increasing.
Example 6: Average cost
A small business spends $500 to set up a production run, plus $4 for each item. The average cost per item when items are made is
The $500 setup cost is shared among all items, so that part of the average cost is inversely proportional to . For 50 items, dollars per item. For 500 items, dollars per item. The horizontal asymptote is : the more items the business makes, the closer the average cost gets to $4 per item, but it never quite reaches it.
Applying a model
A model is useful because it answers questions about the data or the situation. Expect to be asked for:
Question | What to do | Units |
Predict a value | Evaluate the model at that input | Output units |
Average rate of change on | Compute | Output units per input unit |
Is the rate of change increasing or decreasing? | Compare average rates of change on back-to-back intervals, or use concavity | None needed |
When is a value, maximum, or minimum reached? | Solve an equation, or use a graph or the vertex | Input units |
Pull the units from the context. If counts visitors and is in hours, an average rate of change is in visitors per hour.
Example 7: Rates of change from a model (AP-style)
Use the park model from Example 3, where is hours after 8 AM.
(a) Find the average rate of change of from to , and interpret it.
From 10 AM to noon, the model says the number of visitors increased by an average of 14.916 visitors per hour.
(b) Find the average rate of change of from to .
From 2 PM to 4 PM, the number of visitors decreased by an average of 4.836 visitors per hour.
(c) Is the rate of change of increasing or decreasing? Explain.
Decreasing. The average rate of change dropped from to visitors per hour on later intervals. That matches the model: its leading coefficient is negative, so the graph is concave down and the rate of change keeps decreasing.
(d) When does the model predict the most visitors?
About 6.021 hours after 8 AM, which is just after 2 PM. Then , so the model predicts a peak of about 105 visitors.
Common mistakes
- Leaving out units or context. “14.916” isn't a complete answer. “The number of visitors increased by an average of 14.916 visitors per hour from 10 AM to noon” is.
- Ignoring the domain. The arch model only makes sense for , and the light model only for .
- Rounding in the middle of a problem. Keep the calculator's full values (or at least the model's given coefficients) through every step, and round only the final answer.
- Picking a regression without a reason. Decide the type from the shape of the data or its differences first, then run the regression.
- Pieces that don't connect. If the real situation has no jump, check that the pieces of a piecewise model give the same value where they meet.
- Forgetting to square in an inverse square model. Doubling the distance cuts the force to one fourth, not one half.