

1.2 - Rates of Change
Overview
A rate of change measures how fast one quantity changes compared to another. In this topic you'll find average rates of change over an interval, use them to estimate the rate of change at a single point, compare rates at two points, and explain what the sign of a rate tells you. Rates of change show up in almost every free-response question, usually with units and a sentence of interpretation.
Average rate of change
The average rate of change of a function over the interval from to is the change in output divided by the change in input:
Here's what it means: it's the constant rate of change that would produce the same total change in output over that interval. The function might speed up and slow down along the way, but if it had changed at this one steady rate instead, it would end at the same output.
The units are always output units per input unit, like meters per second or dollars per item.
Example 1: Filling a pool
Let be the volume of water in a pool, in cubic meters, minutes after a pump turns on. Selected values are shown in the table.
(minutes) | ||||
(cubic meters) |
Find the average rate of change of over , and interpret it.
Answer: From to minutes, the volume of water increased at an average rate of cubic meters per minute. A pump adding exactly cubic meters every minute would have added the same cubic meters over those minutes.
Rate of change at a point
The rate of change at a point tells you how fast the outputs would change if the inputs changed right at that point. The average rate of change formula needs two different inputs, so it can't give you this directly. Instead, you approximate it with average rates of change over small intervals containing the point. The smaller the interval, the better the estimate.
Example 2: Shrinking the interval
Estimate the rate of change of at .
Find the average rate of change from to inputs closer and closer to :
Interval | Average rate of change |
Each average rate of change is the slope of the line through and the other point. The first three are drawn below.
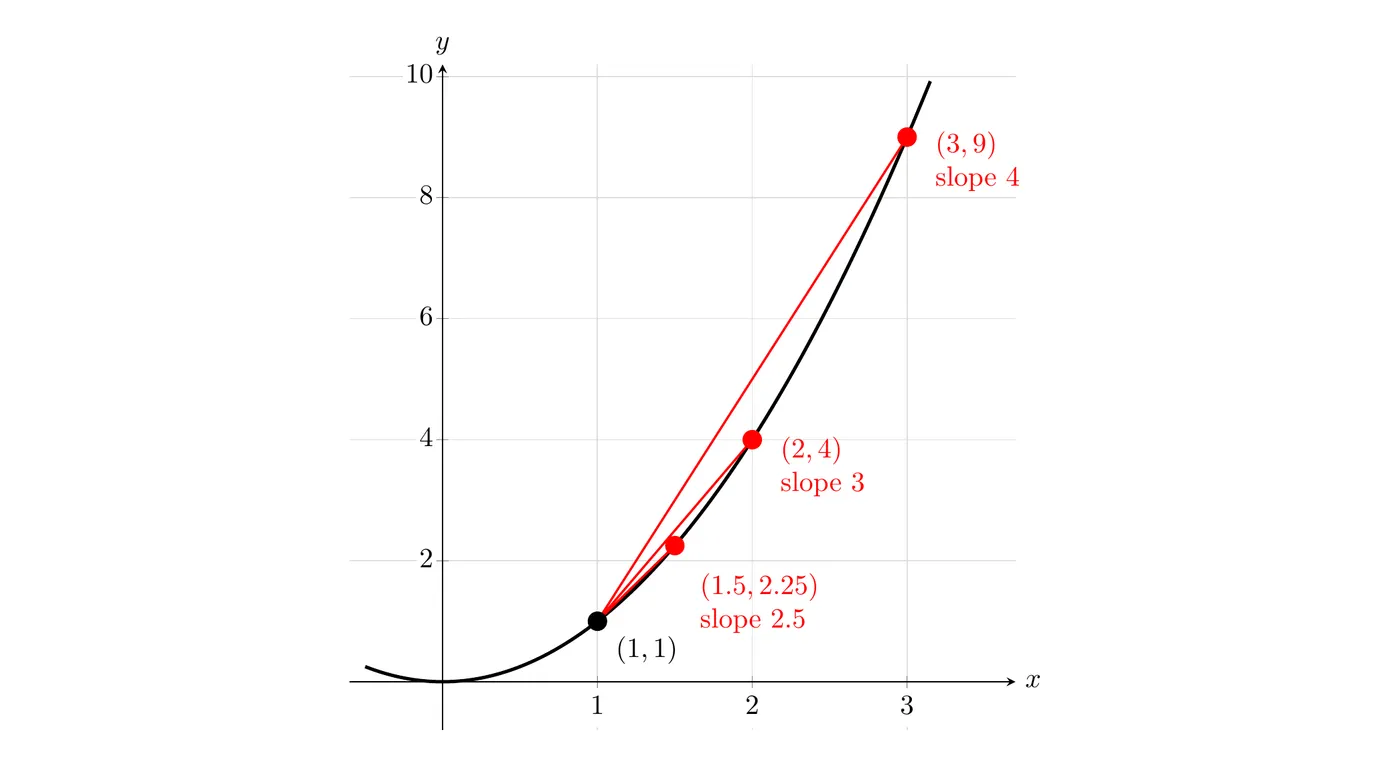
Answer: as the interval shrinks, the average rates of change get closer and closer to . So the rate of change of at is about .
On the exam, you usually can't shrink the interval yourself. You'll get a table and use the smallest interval it gives you around the point.
Comparing rates of change at two points
To compare how fast a function changes at two points, estimate the rate at each point with an average rate of change over a small interval containing that point, then compare the estimates. Use the smallest intervals the information allows, and make sure each interval contains its point.
Example 3: Population growth (AP-style)
The table gives the population of a town, in thousands of people, years after 2010. Is the population increasing faster at or at ? Give a reason for your answer.
(years) | ||||||
(thousands) |
Step 1: Pick the smallest interval in the table that contains each point. For , use . For , use .
Step 2: Find each average rate of change.
Step 3: Compare, and conclude in context.
Answer: The population is increasing faster at . The average rate of change over is thousand people per year, which is greater than the average rate of change over , which is thousand people per year. These average rates estimate the rates of change at and .
What the sign of a rate tells you
Rates of change describe how two quantities vary together. The sign tells you the direction:
- Positive rate of change: the two quantities move in the same direction. As one increases, the other increases, and as one decreases, the other decreases.
- Negative rate of change: the quantities move in opposite directions. As one increases, the other decreases.
- Zero average rate of change: the output is the same at both ends of the interval. That doesn't mean the output stayed constant in between, only that it ended where it started.
The size (absolute value) of the rate tells you how fast. A rate of means faster change than a rate of , just in the opposite direction.
Example 4: Interpreting a negative rate
Let be the depth of water in a tank, in centimeters, minutes after a drain opens. The average rate of change of over is . Interpret this value.
Answer: From to minutes, the depth of the water decreased at an average rate of centimeters per minute. The rate is negative because as time increases, the depth decreases.
Over those minutes, the total change is , so the water level dropped centimeters.
Common mistakes
- Flipping the fraction. The change in output goes on top: , not .
- Mismatched order. If you subtract on top, subtract on the bottom. Putting on the bottom flips the sign.
- Leaving out units or context. "0.4" isn't a full answer. Say what changed, over what interval, and in what units, like cubic meters per minute.
- Using an interval that doesn't contain the point. To estimate the rate of change at , the interval has to include .
- Reading a negative rate as "slow." A negative rate means the output is decreasing. The size of the rate tells you how fast.