

2.11 - Logarithmic Functions
Overview
A logarithmic function in general form is , where , , and . Because logs are the inverses of exponentials, their graphs have the same kinds of features as exponential graphs, just reflected over the line . This topic is about reading those features: domain and range, where the function increases or decreases, concavity, extrema, and the vertical asymptote. The AP exam asks you to describe them from an equation, a graph, or a table.
Domain and range
The domain of a logarithmic function in general form is all real numbers greater than zero, . The range is all real numbers.
- Why the domain is : asks "what power of gives ?" A positive base raised to any power is always positive, so there's no answer when is zero or negative. For example, is undefined because no power of 2 equals .
- Why the range is all real numbers: every real number can be an exponent, so every real number shows up as an output. when , and when .
This is the domain and range of , swapped (Topic 2.10). That always happens with inverse functions: the inputs of one are the outputs of the other.
Feature | ||
Domain | all real numbers | |
Range | all real numbers | |
Asymptote | horizontal, | vertical, |
Points on every graph | and | and |
For the general form , the graph always passes through , because , and through , because .
Shifted inputs shift the domain. For , the input of the log must be positive: , so the domain is . Set whatever is inside the log greater than zero and solve.
Always increasing or always decreasing
Because logarithmic functions are inverses of exponential functions, they act like exponentials in one big way: a logarithmic function is either always increasing or always decreasing. It never turns around.
- If , then is increasing. Bigger inputs need bigger exponents: and .
- If , then is decreasing. With base , bigger inputs need more negative exponents: and .
- If , the graph is reflected over the -axis, which turns increasing into decreasing (and the other way around).
Concavity
A logarithmic function is also either always concave down or always concave up. In the most common case, and , the graph is increasing and concave down: it keeps rising, but more and more slowly.
You can see this with average rates of change over equal-length intervals. For :
Interval | Average rate of change of |
The rate of change keeps shrinking, so the graph is concave down. Here are all four cases:
and | Increasing or decreasing | Concavity |
, (like ) | increasing | concave down |
, (like ) | decreasing | concave up |
, (like ) | decreasing | concave up |
, (like ) | increasing | concave down |
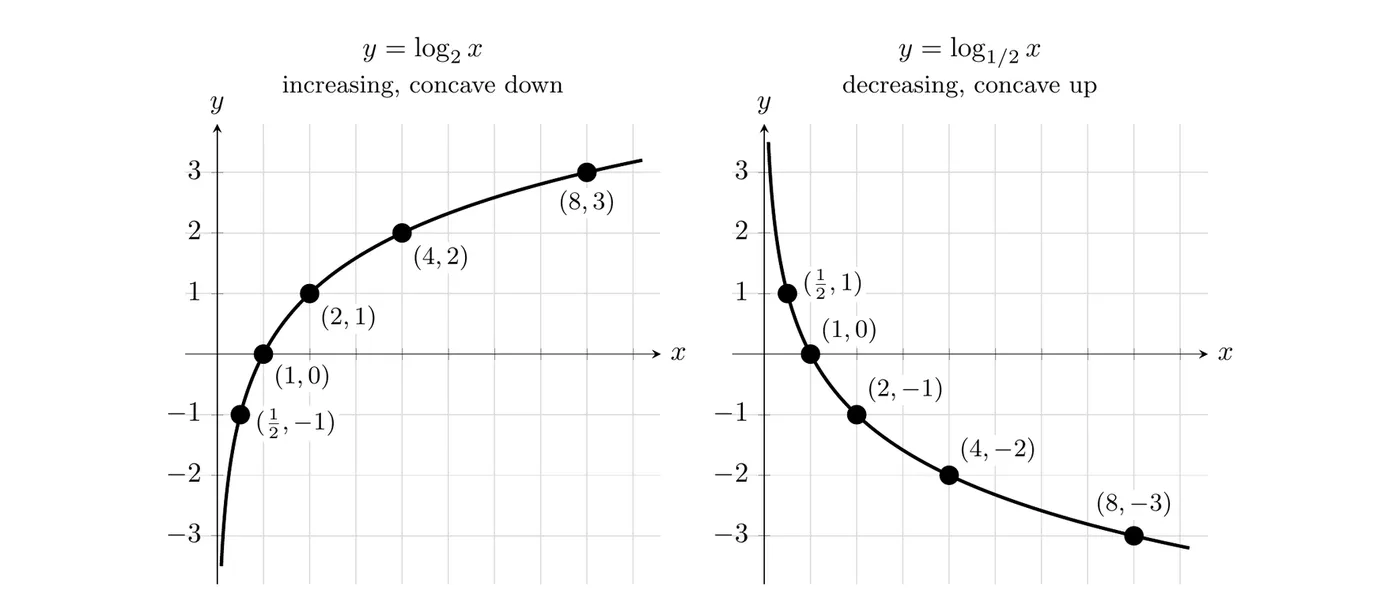
Notice the pattern: an increasing log is always concave down, and a decreasing log is always concave up. (In fact and are the same function. You'll see why with the change of base property in Topic 2.12.)
No extrema and no points of inflection
Since a logarithmic function is always increasing or always decreasing, it has no maximum or minimum on its whole domain. The only way to get extrema is to restrict it to a closed interval . Then the extrema are at the endpoints: an increasing log has its minimum at and its maximum at , and a decreasing log is the reverse.
Since the concavity never changes, the graph has no points of inflection.
Vertical asymptote and end behavior
With its limited domain, a logarithmic function in general form has a vertical asymptote at (the -axis). As gets close to 0 from the right, the outputs grow without bound in one direction, and as grows, the outputs grow without bound in the other direction. For :
We only use (from the right) because the function doesn't exist to the left of 0.
The second limit surprises a lot of students. Log graphs look like they flatten out, but they never level off, so there's no horizontal asymptote. They just grow very slowly. For example, (base 10) only reaches 6 at , but it keeps going: any height you pick is reached by some input.
Case | ||
increasing (, or , ) | ||
decreasing (, or , ) |
Shifted asymptotes: has its vertical asymptote at , where the inside of the log equals zero.
Horizontal shifts hide the input pattern
Remember from Topic 2.10 that logs turn multiplication into addition. For a log in general form, when the outputs go up by equal steps, the inputs get multiplied by the same number each time. The input values are proportional over equal-length output intervals. For :
1 | 2 | 4 | 8 | 16 | |
0 | 1 | 2 | 3 | 4 |
Each output step of 1 multiplies the input by 2. A horizontal shift breaks this pattern. Take :
1 | 5 | 13 | |||
0 | 1 | 2 | 3 | 4 |
The outputs still go up by 1 each time, but the inputs have no common ratio: , , and . So an additive transformation with does not have proportional inputs over equal-length output intervals.
It also works in reverse, and that's the useful part on the exam: if adding the same constant to every input makes the inputs proportional over equal-length output intervals, the function is logarithmic. Here, adding 3 to each input gives 1, 2, 4, 8, 16, with a common ratio of 2. So the table comes from a log function shifted 3 units left.
Quick tell: look at the differences between inputs. Here they are 1, 2, 4, 8, which have a common ratio. That's a sign a shifted log pattern is hiding in the table.
Examples
Example 1: Key features from an equation
Describe the domain, range, increasing or decreasing behavior, concavity, and end behavior of .
- Domain and range: domain , range all real numbers.
- Increasing or decreasing: , so increases. But reflects it over the -axis, so is decreasing.
- Concavity: a decreasing log is concave up.
- End behavior: vertical asymptote at , with and .
- Points: and , so the graph passes through and .
Answer: is defined for , takes on every real output, and is decreasing and concave up everywhere. It shoots up toward near the -axis and falls without bound as .
Example 2: A shifted log hiding in a table (AP-style)
Could this table come from a logarithmic function? If so, find one.
3 | 11 | ||||
1 | 2 | 3 | 4 | 5 |
Step 1: Check the inputs for a common ratio. The outputs go up by 1 each time, so check the inputs: but . No common ratio, so the inputs aren't proportional yet.
Step 2: Look for a hidden shift. The differences between inputs are 1, 2, 4, 8, which double each time. That suggests the inputs become proportional after adding some constant . If doubles from one column to the next, then
Step 3: Check. Adding 5 to each input gives 1, 2, 4, 8, 16, with a common ratio of 2. So the outputs go up by 1 each time doubles, which is a pattern:
Test it: gives , and gives . Every column checks.
Answer: yes. The inputs are proportional over equal-length output intervals once 5 is added to each one, so the data fits the logarithmic function .
Example 3: Extrema on a closed interval (AP-style)
Let .
- Find the domain and the vertical asymptote.
- Is increasing or decreasing? What is its concavity?
- Find the maximum and minimum values of on the interval .
- Describe the end behavior of using limits.
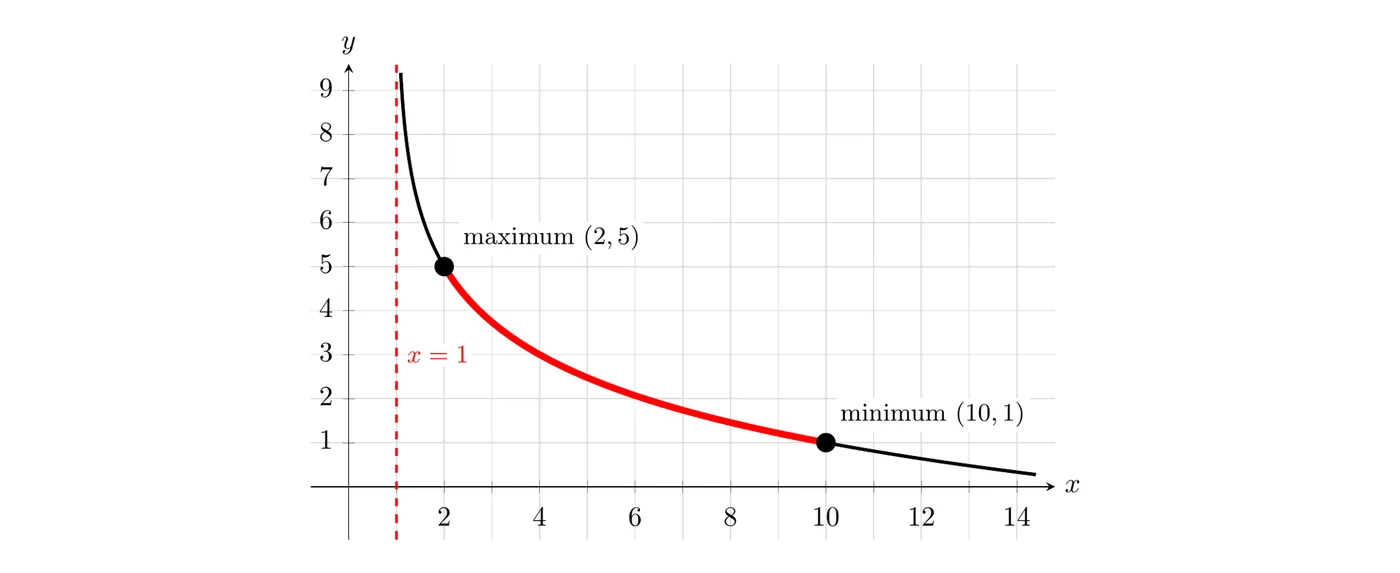
Part 1: the input of the log must be positive: , so the domain is . The vertical asymptote is .
Part 2: the base is and , so is decreasing and concave up. The shift right 1 and up 5 don't change either of these.
Part 3: since is decreasing, the maximum is at the left endpoint and the minimum is at the right endpoint:
Part 4: near the asymptote the outputs blow up, and they fall without bound to the right:
Answer: on , the maximum value of is 5 (at ) and the minimum value is 1 (at ). On its whole domain , has no maximum or minimum.
Common mistakes
- Plugging in zero or a negative number. and don't exist. For a shifted log, set the inside greater than zero to find the domain.
- Thinking the graph levels off. Log functions grow slowly, but is infinite. There is no horizontal asymptote.
- Giving a log an extremum on its whole domain. It only has a max or min on a closed interval, and those are at the endpoints.
- Forgetting that flips both behaviors. A negative changes increasing to decreasing and concave down to concave up.
- Writing instead of . The function only exists to the right of the asymptote.
- Giving up on a table too fast. If the inputs aren't proportional, try adding a constant to every input before deciding the data isn't logarithmic.