

2.3 - Exponential Functions
Overview
An exponential function multiplies its output by the same factor every time the input goes up by 1. That one fact controls its whole graph: it's always increasing or always decreasing, it never changes concavity, and on one side it levels off toward a horizontal asymptote. This topic covers the general form and the key features the AP exam asks you to identify.
The general form
- is the initial value: . It's the -intercept.
- is the base: the factor the output is multiplied by each time goes up by 1.
Each restriction has a reason:
- , because a negative base breaks down for many inputs. For example, isn't a real number.
- , because for every , so would just be a constant function.
- , because otherwise for every .
Two special names, both with :
- Exponential growth: and .
- Exponential decay: and .
What the input counts
When the input is a natural number, it tells you how many factors of the base get multiplied onto the initial value. For :
But the domain of an exponential function is all real numbers, not just whole numbers, and other inputs still have meaning:
- : zero factors of 2, so just the initial value.
- : a negative input divides by the base instead.
- : a fractional input applies part of a factor.
That's why the graph is one smooth, unbroken curve instead of a set of dots.
Always increasing or decreasing, never changing concavity
Because the outputs are proportional over equal-length intervals, for every . Take growth ( and ). Every step multiplies by something bigger than 1, so the function always increases. The size of each step is
which gets bigger as gets bigger. The rate of change keeps increasing, so the graph is concave up everywhere. The same reasoning works for the other three cases:
Increasing or decreasing | Concavity | Example | ||
increasing | concave up | (growth) | ||
decreasing | concave up | (decay) | ||
decreasing | concave down | |||
increasing | concave down |
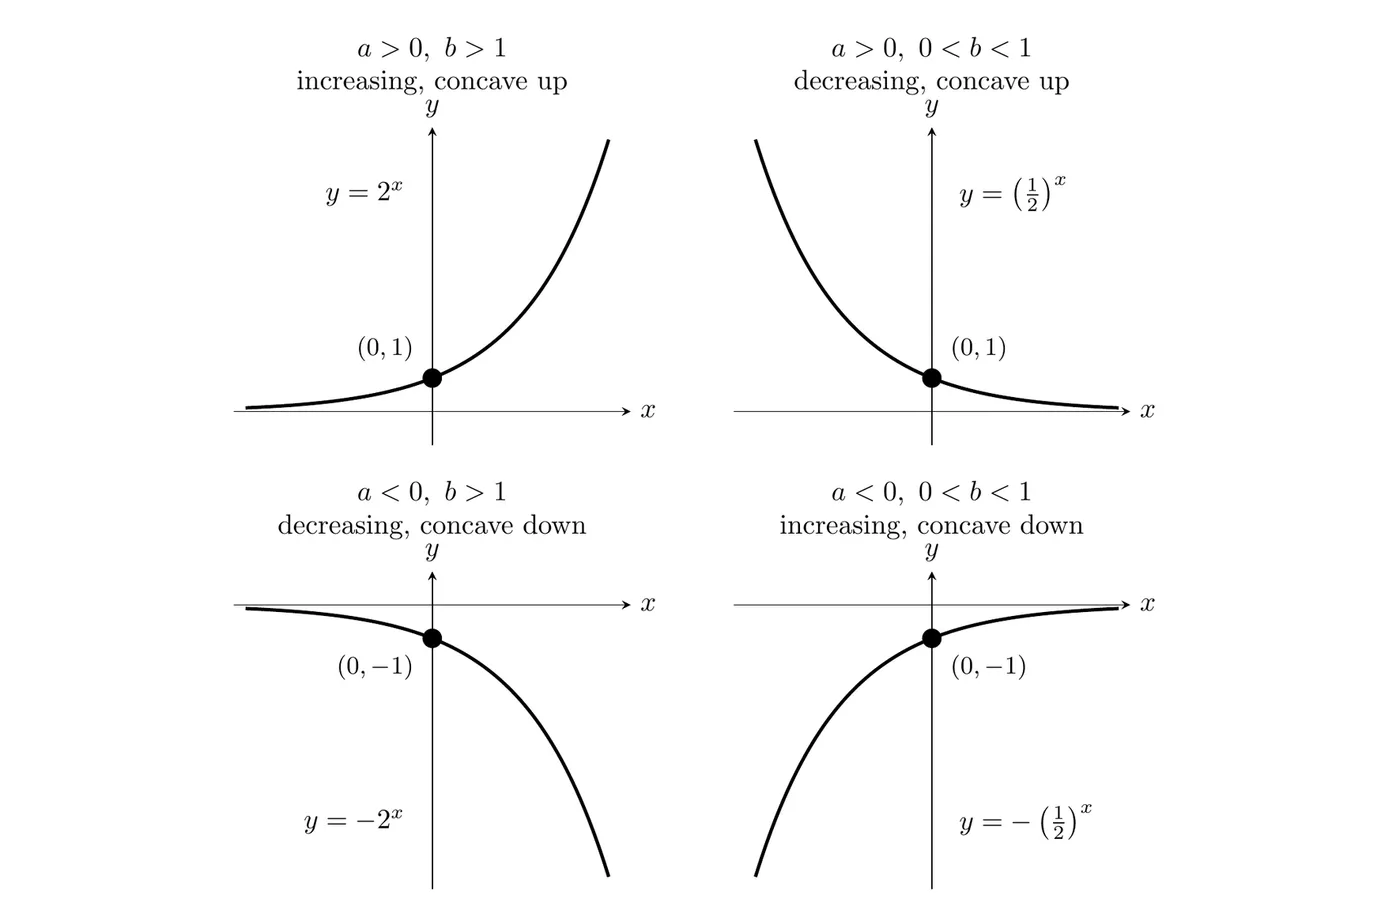
A quick way to remember it: the sign of sets the concavity (positive means concave up, negative means concave down). When , the graph is a growth or decay graph flipped over the -axis.
Two consequences the AP exam tests directly:
- No extrema on the whole domain. An exponential function never turns around, so it has no relative or absolute maximum or minimum. On a closed interval it does have both, and they're at the endpoints.
- No points of inflection. The concavity never changes, so there's no point where it switches.
Example 1: Key features from the formula
Describe the key features of .
- and , so is decreasing and concave down.
- Initial value: , so the -intercept is .
- Since for every , is always negative. The range is , and there are no zeros.
- As increases, grows without bound, so decreases without bound. As decreases, shrinks toward 0, so approaches 0 from below.
Answer: decreasing, concave down, -intercept , range , no zeros, no extrema, and no points of inflection.
Example 2: Extrema on a closed interval
Find the maximum and minimum values of on the interval .
Here and , so is always decreasing. A decreasing function is largest at the left endpoint and smallest at the right endpoint.
Answer: on , the maximum value is 16 (at ) and the minimum value is 1 (at ). On all real numbers, has no maximum or minimum.
End behavior and the horizontal asymptote
For an exponential function in general form, one end of the graph goes off to or , and the other end gets arbitrarily close to 0. In limit notation:
Case | ||
, | ||
, | ||
, | ||
, |
Since one side approaches 0, the line (the -axis) is a horizontal asymptote. The graph gets closer and closer to it but never reaches it, because is never 0. So has no zeros.
Why does approach 0 as when ? Multiplying by a number less than 1 over and over keeps shrinking the value: and .
Exponential plus a constant
Sometimes a function's outputs aren't proportional over equal-length intervals, but they become proportional after you add or subtract a constant. Then the function can be modeled by an additive transformation of an exponential function:
Adding shifts the whole graph up units. The horizontal asymptote moves to , and the end behavior approaches instead of 0. Whether the function increases or decreases, and its concavity, don't change.
Example 3: Finding the hidden exponential
Show that the function in the table is not of the form , then find a model for it.
0 | 1 | 2 | 3 | 4 | |
7 | 10 | 16 | 28 | 52 |
Step 1: check the ratios. , , and aren't constant, so is not of the form .
Step 2: look at the differences: 3, 6, 12, 24. Each one is double the one before. For , the constant cancels when you subtract,
so the differences are themselves exponential with the same base. That makes .
Step 3: find and . The first difference is , so . Then gives , so .
Step 4: check by subtracting 4 from every output: 3, 6, 12, 24, 48. Each value is double the one before, so .
Answer: . Its graph is the graph of shifted up 4, with horizontal asymptote , so .
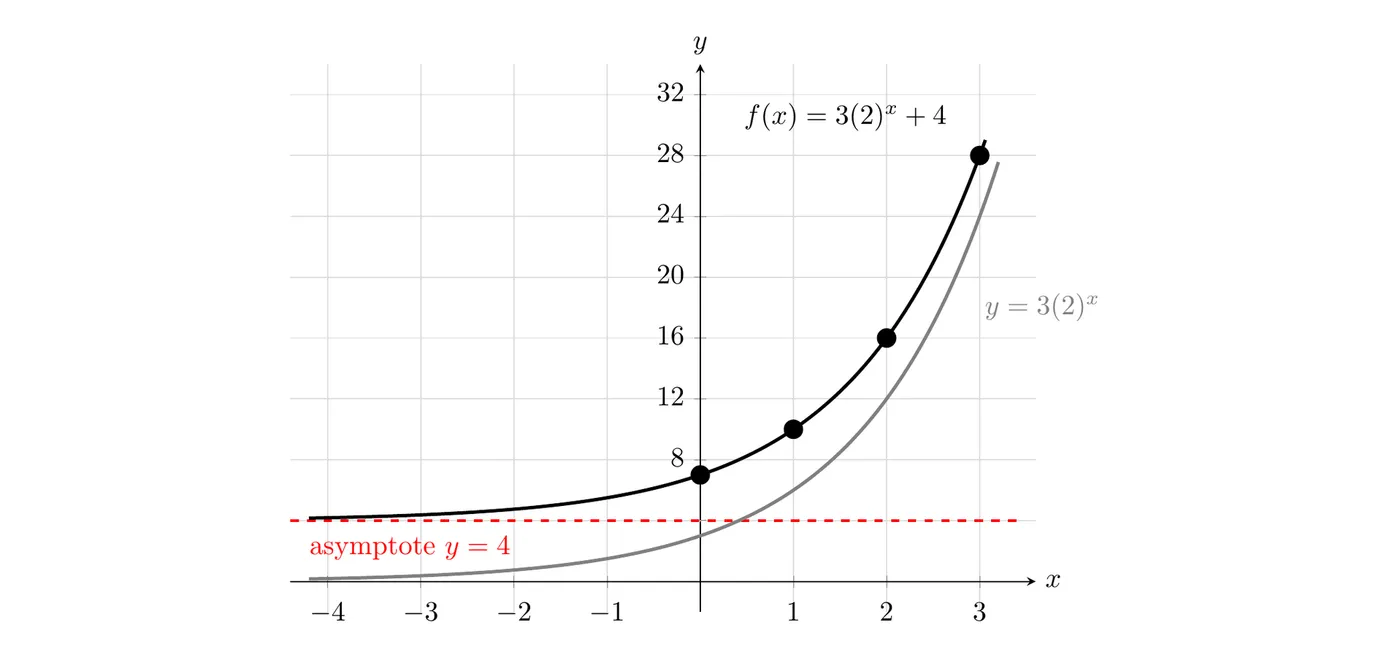
In real contexts the constant is often given to you, like room temperature for a cooling drink. You'll build models like that in Topic 2.5.
Common mistakes
- Calling every decreasing exponential function decay. Decay means and . The function decreases, but it's a growth function flipped over the -axis, not exponential decay.
- Thinking the graph touches the asymptote. is never 0, so the graph never crosses or touches .
- Claiming an extremum without a closed interval. On all real numbers, an exponential function has no maximum or minimum. The -intercept is not a minimum.
- Raising the coefficient to the power. is not . In only the 3 is raised to the power: , but .
- Forcing the basic form onto shifted data. If the ratios aren't constant, check whether the differences have a constant ratio, or whether subtracting a constant makes the outputs proportional, before giving up on an exponential model.