

2.14 - Logarithmic Function Context and Data Modeling
Overview
Logarithmic models fit situations where the input has to be multiplied by the same amount to make the output go up by the same amount. They're the flip side of exponential models: an exponential model tells you how big something is after steps, and a log model tells you how many steps it took to get that big. This topic covers when a log model fits, how to build one from a context, from two points, or from data, and how to use it to answer questions.
When a logarithmic model fits
Logarithmic functions are inverses of exponential functions, so they model proportional growth (repeated multiplication) seen from the other side. In a log model, the input values change proportionally over equal-length output intervals: every time the output changes by the same amount, the input has been multiplied by the same factor.
- Sound level: every time the intensity of a sound is multiplied by 10, its level goes up 10 decibels.
- pH: every time the hydrogen ion concentration is multiplied by 10, the pH goes down 1.
- Earthquake magnitude: every time the seismic wave amplitude is multiplied by 10, the magnitude goes up 1.
- Doublings: the number of times an amount has doubled goes up 1 every time the amount is multiplied by 2.
Whole-number outputs
When the output of a log model is a whole number, it tells you how many times the starting value has been multiplied by the proportion.
Say a bacteria culture starts with 500 cells and doubles every hour. The exponential model is . Its inverse tells you how many doublings it takes to reach cells:
: to get from 500 cells to 4000 cells, the starting amount was multiplied by 2 three times (). Outputs that aren't whole numbers still make sense: , so it takes about 4.32 doublings, or about 4.32 hours.
Building a model from a proportion and a zero
Suppose you know the proportion (the input is multiplied by each time the output goes up by 1) and the zero (the input where the output is 0). Then the model is
This works because , and multiplying by adds to the output. If each multiplication by adds to the output instead of 1, use .
Example 1: A model from a proportion and a zero
A logarithmic function has a zero at . Each time the input is multiplied by 3, the output increases by 2. Write a formula for , then find and .
The proportion is 3, each multiplication adds 2, and the zero is at :
That fits the pattern: is two multiplications by 3, and each one adds 2.
Answer: , with and .
Building a model from two points
With two input-output pairs, use the form . Plug in both points and solve the system for and . The natural log is the usual choice here (it's what calculators use, and it's common in real-world models), but any base works: by change of base, is just a different constant times .
Example 2: A model from two points (AP-style)
Suppose a student's typing speed after weeks of practice is modeled by , in words per minute. After 1 week the student types 30 words per minute, and after 4 weeks, 45 words per minute.
- Find and .
- Predict the student's speed after 8 weeks.
- When does the model predict the student will reach 60 words per minute?
Part 1: use first, since :
Then use :
By change of base, the model is also . That form shows the proportional pattern: every time the practice time is multiplied by 4, the speed goes up 15 words per minute.
Part 2: use the base 4 form, since :
Part 3: set the model equal to 60 and solve for the input:
Answer: and . The model predicts about 52.5 words per minute after 8 weeks, and 60 words per minute after 16 weeks of practice.
Building a model with transformations
Sometimes the context tells you how to transform :
- Where the asymptote goes. is undefined at . If the inputs start at 0 (like months), shift left: is defined at , with .
- A reference value. Many science scales divide the input by a reference amount, so the output is 0 at that amount. That's a horizontal dilation, which by the product property is also a vertical translation.
- How fast it changes. A vertical dilation by sets how much the output goes up for each multiplication of the input.
Example 3: The decibel scale
The sound level, in decibels, of a sound with intensity (in watts per square meter) is .
- Find the sound level of normal conversation, which has intensity .
- How much does the sound level go up when the intensity doubles?
- A concert measures 110 decibels. Find its intensity.
Part 1:
Part 2: use the product property on :
Doubling the intensity adds about 3 decibels, no matter how loud the sound started.
Part 3: this time you know the output and need the input:
Answer: conversation is 60 decibels, doubling the intensity adds about 3.01 decibels, and the concert's intensity is 0.1 watts per square meter. (The model is shifted up 120, since .)
Logarithmic regression
For a data set, technology can find the best log model. A log model fits data that rises (or falls) quickly at first and then keeps changing more and more slowly, without leveling off. On a TI-84:
- Press STAT, choose Edit, and enter the inputs in L1 and the outputs in L2. Every input must be positive.
- Press STAT, arrow over to CALC, and choose LnReg. Use L1 and L2 as the lists, then Calculate.
- The calculator gives and for , plus and (turn on Stat Diagnostics in the mode menu if you don't see them).
Example 4: Logarithmic regression (AP-style)
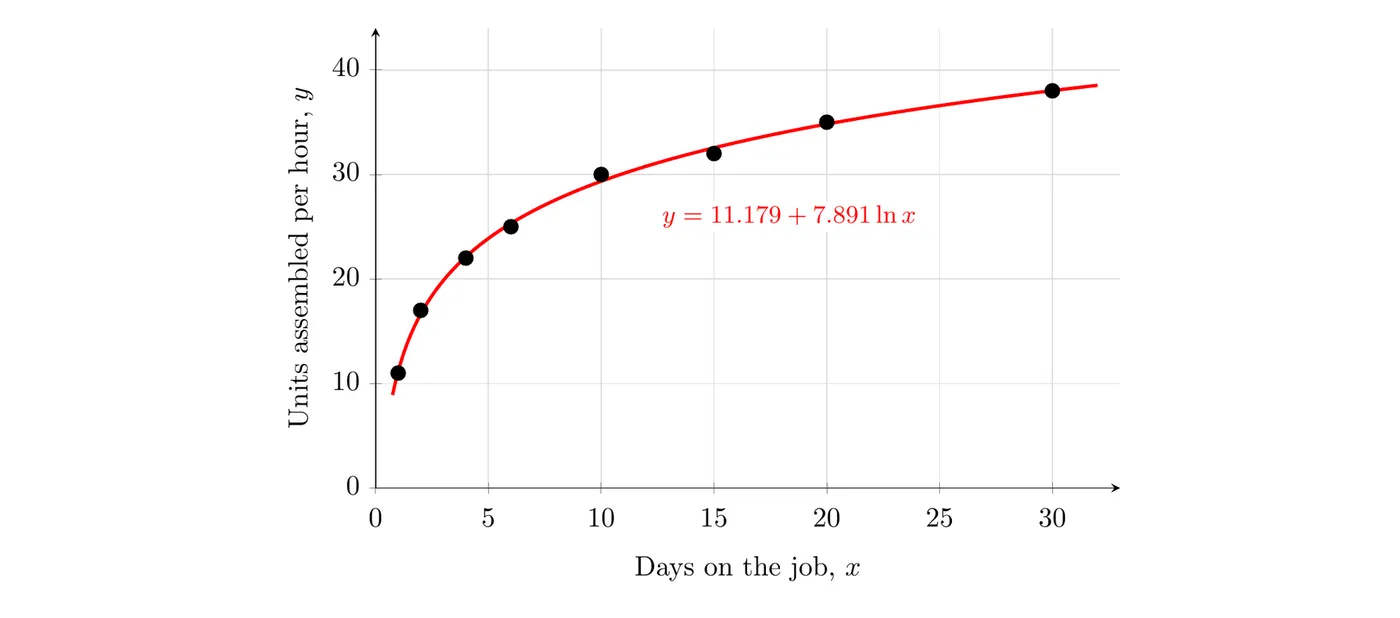
Suppose a factory tracks how many units a new employee assembles per hour after days on the job (made-up data for practice).
Days on the job, | 1 | 2 | 4 | 6 | 10 | 15 | 20 | 30 |
Units per hour, | 11 | 17 | 22 | 25 | 30 | 32 | 35 | 38 |
- Find a logarithmic regression model for the data.
- Predict the employee's rate after 25 days.
- Use the model to estimate when the rate will reach 36 units per hour.
Part 1: LnReg on the data gives
with . The points hug the curve, so the log model fits well.
Part 2: plug in :
Part 3: set the model equal to 36 and solve for :
Answer: the model is . It predicts about 36.6 units per hour after 25 days, and a rate of 36 units per hour after about 23.2 days on the job. Be careful predicting far past 30 days: the model keeps rising forever, but a real worker's speed will level off at some point.
Using a log model
Once you have a model, you can use it in both directions:
- Predict the output: plug in the input. ( words per minute in Example 2.)
- Find the input: set the model equal to the output and solve, usually by rewriting the log in exponential form. ( gave weeks.)
On the AP exam you won't be asked to explain what and mean in context for a model like . You will be asked to build the model and use it to answer questions, with units.
Common mistakes
- Using a log model when the input can be 0 or negative. The log is undefined there. Shift the input first, for example .
- Mixing up which variable changes proportionally. In a log model the input gets multiplied while the output changes by equal steps. In an exponential model it's the other way around.
- Rounding and too early. Keep at least three decimal places (or store the full values in your calculator) until the final answer.
- Extrapolating too far. Log models never level off, but many real quantities do.
- Leaving out units and context. "23.2" isn't an answer; "about 23.2 days on the job" is.