

2.15 - Semi-log Plots
Overview
A semi-log plot is a graph where the -axis is on a logarithmic scale and the -axis stays normal. Its big payoff: exponential data shows up as a straight line. That gives you a quick visual test for whether an exponential model fits, and it lets you use everything you know about lines to build that model.
What a semi-log plot is
On a normal axis, equal steps add the same amount: 0, 1, 2, 3. On a logarithmic scale with base (where ), equal steps multiply by . With base 10, the gridlines are labeled 1, 10, 100, 1000, and each step up is 10 times bigger than the one before.
In a semi-log plot only one axis gets this treatment, and in AP Precalculus it's always the -axis. The height of a point is really , even though the label shows itself.
- Halfway between 10 and 100 is not 55. It's , because height measures , and halfway between and is 1.5.
- The smaller gridlines between 10 and 100 are 20, 30, and so on up to 90. They get closer together as you go up.
- There's no 0 on a log scale (since is undefined), so semi-log plots only work for positive -values.
Why exponential data looks linear
Take the log of both sides of an exponential model , then use the product and power properties from Topic 2.12:
That's a linear function of , with slope and vertical intercept . A semi-log plot graphs against , so data or functions with exponential characteristics appear linear on a semi-log plot.
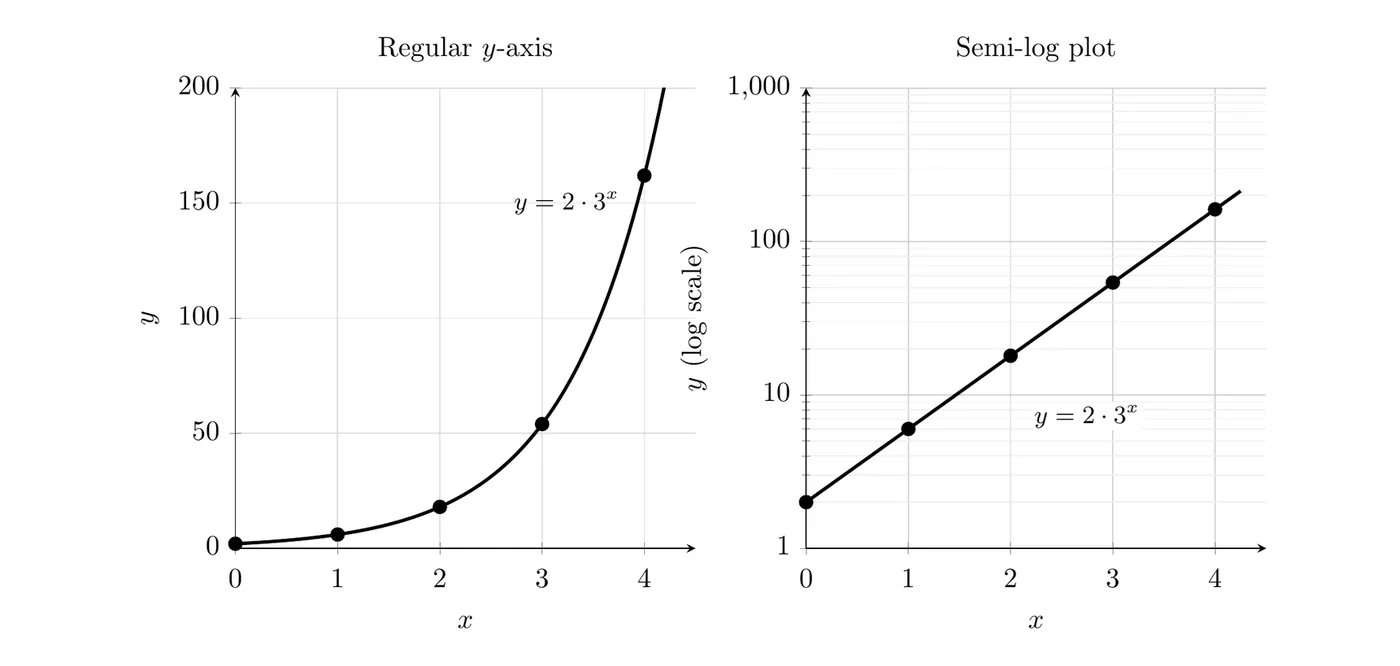
On regular axes, curves up steeply. On the semi-log plot, the same points () sit on a straight line. Each step of 1 in multiplies by 3, and multiplying by 3 always moves up the same distance on a log scale ().
Is an exponential model appropriate?
To decide, make a semi-log plot of the data (or take the log of every -value) and look at the shape:
- The points fall close to a line: an exponential model is appropriate.
- The points keep bending: the data isn't exponential. For example, bends on a semi-log plot, because each step of 1 in multiplies by a smaller factor each time (, then , then about ).
Exponentials with a constant added
Real data often looks like an exponential plus a constant, . On a semi-log plot that isn't a perfect line. But if the logs of the outputs trend linear for large input values, a transformation of an exponential function can model the data. When gets large, the constant hardly matters, so the points line up.
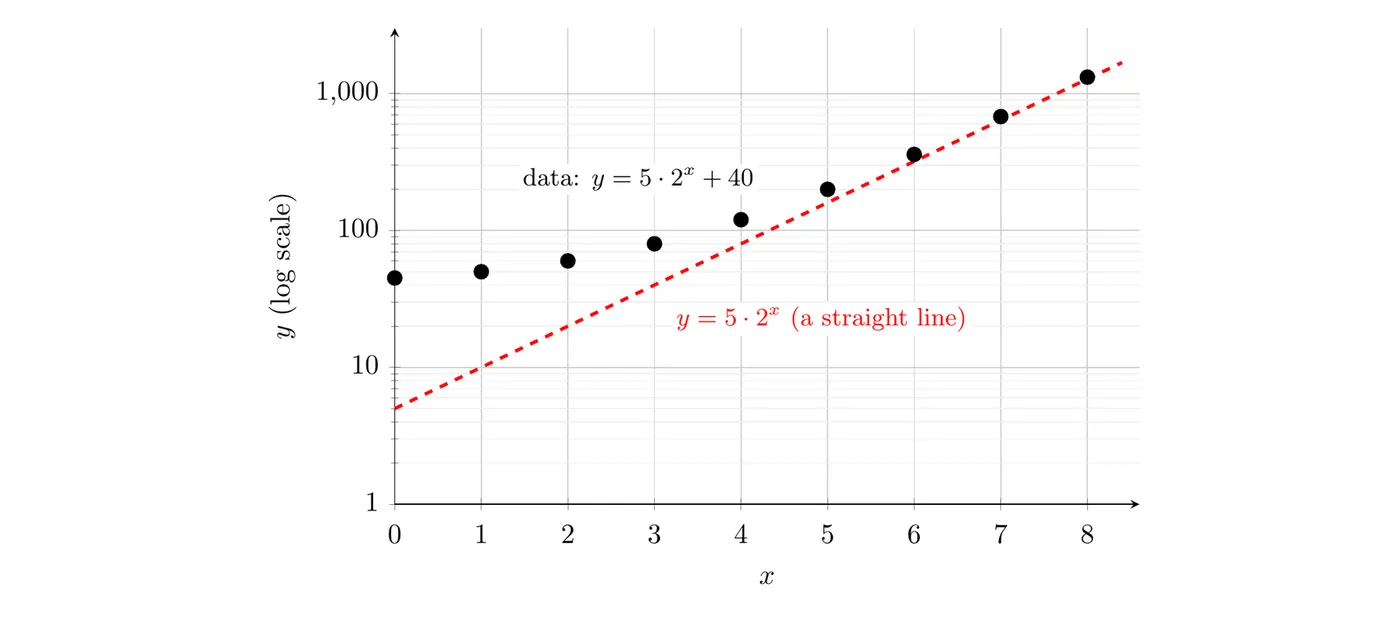
Here the data comes from . For small , the is most of each value and the points bend. For large , they line up along the line for , rising at the same steady rate. That's an advantage of semi-log plots: you don't need to figure out the constant and subtract it from every -value first. The straight trend for large inputs already tells you a transformed exponential model fits.
Linearizing exponential data
Linearizing means turning exponential data into linear data by taking the log of every output. For an exponential model , the matching linear model for the semi-log plot is
where and is the base of the log (usually 10 or ). The pieces match up like this:
Exponential model | Linear model on the semi-log plot |
growth factor | linear rate of change (slope) |
initial value | initial linear value (vertical intercept) |
To go back from the line to the exponential, undo the logs: and .
Every technique you use for linear functions works on a semi-log graph: the slope from two points, point-slope form, and linear regression.
Example 1: From an exponential model to a line
Find the linear model for the semi-log plot (base 10) of .
Answer: . On the semi-log plot, the line starts at a height of and rises 0.176 for each step of 1 in .
Example 2: From a line back to an exponential model
A semi-log plot of a data set uses the natural log. The points fall along the line . Find an exponential model for the data.
The slope is , so . The intercept is , so .
Answer:
Example 3: Modeling data with a semi-log plot (AP-style)
Suppose a biologist measures the area of a pond covered by an invasive water plant at the start of each week (made-up data for practice).
Weeks, | 0 | 1 | 2 | 3 | 4 | 5 | 6 |
Area covered (square meters), | 2.0 | 3.1 | 4.4 | 6.9 | 10.0 | 15.4 | 22.6 |
0.301 | 0.491 | 0.643 | 0.839 | 1.000 | 1.188 | 1.354 |
- Explain why an exponential model is appropriate.
- Find a linear model for as a function of .
- Write an exponential model for .
- Predict the area covered after 9 weeks.
Part 1: the values of go up by about the same amount each week (0.190, 0.152, 0.196, 0.161, 0.188, 0.166). So the semi-log plot is close to linear, which means is multiplied by about the same factor each week. That's exponential.
Part 2: run a linear regression on . On a TI-84, put in L1 and in L2, set L3 = log(L2), then run LinReg(ax+b) on L1 and L3:
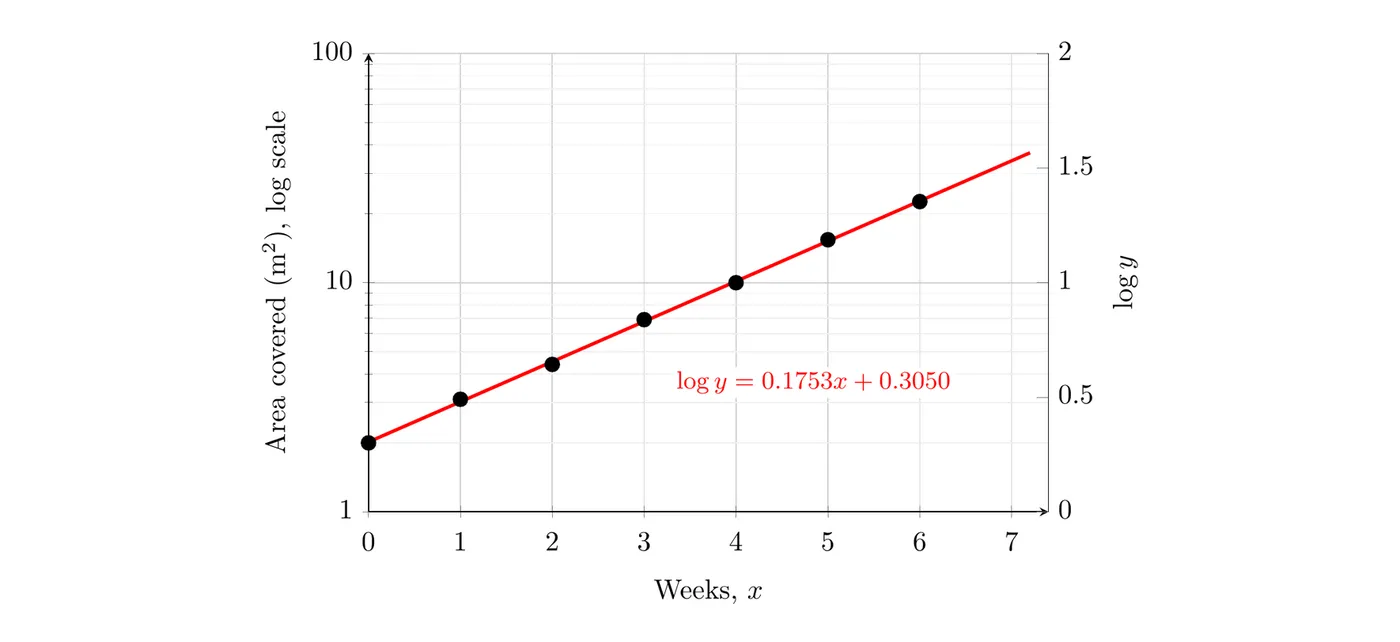
Part 3: undo the logs:
The calculator's ExpReg command on L1 and L2 gives the same model, because it does this linearization behind the scenes (using natural logs).
Part 4: use the linear model, then undo the log:
Answer: the model predicts the plant will cover about 76.3 square meters after 9 weeks, if the growth pattern continues (a real pond eventually runs out of room).
Common mistakes
- Reading a log axis like a normal axis. Halfway between 10 and 100 is about 31.6, not 55.
- Forgetting to undo the logs. The slope of the semi-log line is , not . The growth factor is .
- Mixing bases. If you linearize with (base 10), undo with powers of 10. If you use , undo with powers of .
- Ruling out an exponential model because of a bend at small . Look at the trend for large inputs. The data may be an exponential plus a constant.
- Putting the log scale on the -axis. In this course, semi-log plots scale the -axis.