

2.5 - Exponential Function Context and Data Modeling
Overview
Exponential functions model anything that changes by a constant percent: populations, investments, medicine leaving the body, a cooling cup of coffee. This topic is about building those models (from a percent change, from two data points, from a context, or from a regression) and then using them to answer questions in context. It's the heart of the non-periodic modeling question on the AP exam's free-response section.
When an exponential model fits
Use an exponential model when successive output values over equal-length input intervals are proportional, meaning they have the same ratio. When the inputs are whole numbers (years, days, generations), the model is repeated multiplication: start at the initial value and multiply by the same constant each step.
Phrases that signal an exponential model:
- grows by 6% per year, or decreases by 15% per year
- doubles every 5 hours, or has a half-life of 12 hours
- is multiplied by 1.3 each month
- a table where the ratios of consecutive outputs (over equal input steps) are about the same
Growth factor and percent change
In , the base is the growth factor: the number the output gets multiplied by each time the input goes up by 1. It's tied to the percent change (written as a decimal) by
Description | Percent change | Growth factor |
grows 6% per year | ||
grows 30% per month | ||
loses 15% per year | ||
loses 8% per day |
Going the other way: if , the quantity grows 4.5% per unit, and if , it shrinks 3% per unit.
Example 1: A model from a percent change
A new car is worth $28,000 and loses 15% of its value each year. Write a model for its value after years, and find its value after 4 years.
Each year the car keeps of its value, so and :
Answer: after 4 years, the car is worth about $14,616. Losing 15% a year for 4 years is a total loss of about 48%, not 60%, because each 15% is taken from a smaller value.
A model from two points
If you know two input-output pairs, plug both into . That gives a system of two equations. Dividing one equation by the other cancels and leaves an equation for . Then substitute back to find .
Example 2: Cells in a culture (AP-style)
The number of cells in a lab culture is modeled by , where is time in days. There are 1,200 cells at and 2,700 cells at .
(a) Write two equations that can be used to find and .
(b) Find and .
Divide the second equation by the first. The cancels:
Take the positive root, since . (Exactly, , so .) Then substitute into the first equation:
So .
(c) Interpret and in context.
: the culture had 800 cells at . : the number of cells is multiplied by about 1.225 each day, which is about a 22.5% increase per day.
(d) Use the model to predict the number of cells at .
Answer: about 6,075 cells after 10 days. With the rounded base 1.225 you'd get about 6,088 instead, so keep the full value in your calculator until the last step.
Transformations and added constants
Not every exponential situation fits exactly. You can build a model by applying transformations to based on the context or the data:
- Vertical shift, : the quantity levels off at instead of 0. Cooling and warming problems, where a temperature approaches the room's temperature, are the classic case.
- Horizontal shift, : changes where the input starts, for example when is the calendar year and you want the model based at 2020.
- Horizontal dilation, : sets how many input units one factor of takes, as with a half-life or a doubling time.
The clue for a vertical shift: if the outputs in the data aren't proportional, a constant may need to be added to (or subtracted from) the outputs to reveal a proportional pattern. Subtract the level the quantity approaches, check the ratios, and model what's left.
Example 3: Cooling coffee (AP-style)
A cup of coffee is 180°F when it's poured in a room that stays at 70°F. Ten minutes later, the coffee is 150°F.
(a) Explain why a model of the form doesn't fit.
A model approaches 0 as grows, but the coffee cools toward room temperature, 70°F, not toward 0°F. What decays exponentially is the difference between the coffee and the room: degrees at first, then degrees after 10 minutes.
(b) Write a model of the form .
At : , so . At :
So , or exactly . The gap between the coffee and the room shrinks by about 3.1% each minute.
(c) Predict the temperature after 30 minutes.
After 30 minutes, the coffee is about 112.3°F.
(d) When does the coffee reach 100°F?
Graph and on a graphing calculator and find the intersection: . The coffee reaches 100°F after about 40.8 minutes. (In Topic 2.13 you'll solve this exactly with logarithms.)
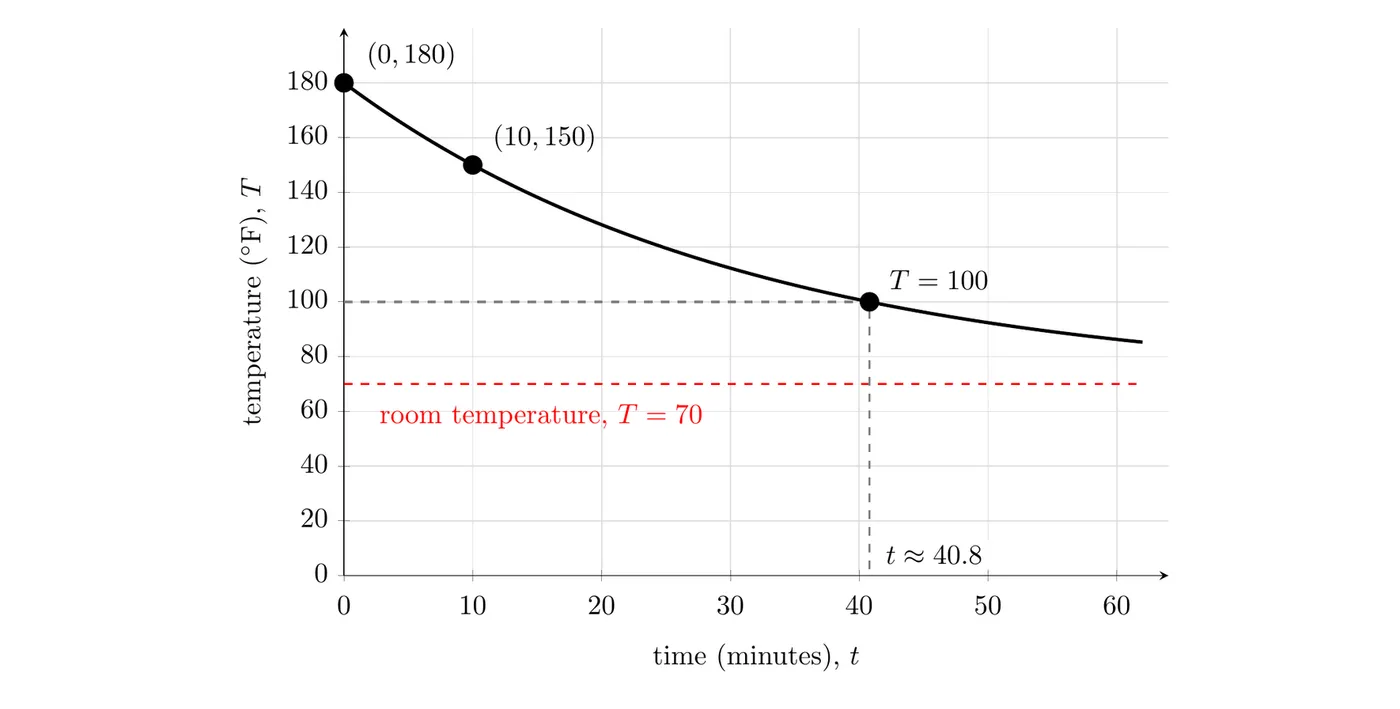
(e) What happens in the long run? As , , so . The coffee approaches room temperature but never drops below it, which matches the horizontal asymptote .
Equivalent forms show different properties
Rewriting a model with the exponent rules from Topic 2.4 can reveal different facts about it. Suppose a savings balance starts at $500 and grows 2% per month, where is the number of months:
The first form says the balance is multiplied by 1.02 every month. The second form says the same balance is multiplied by about 1.268 every year, about 26.8% growth per year, since counts years.
Two general moves:
- Factor over a longer period: shows the factor for every units.
- Factor per single unit: turns "multiplied by every units" into the factor for 1 unit.
Example 4: Half-life
A patient takes 400 mg of a medicine with a half-life of 12 hours. The amount left after hours is mg.
(a) By what percent does the amount decrease each hour?
The hourly factor is about 0.9439, so the amount decreases by about , or 5.6%, each hour.
(b) By what factor does the amount change each day?
Each 24 hours is two half-lives, so the amount is multiplied by 0.25 every day: a 75% decrease per day.
Exponential regression
Real data is rarely perfectly proportional. When the ratios are close to constant, use technology to find the exponential regression, the model that best fits the data. On a TI-84:
- Press STAT, choose 1:Edit, and enter the inputs in L1 and the outputs in L2.
- Press STAT, move to CALC, and choose 0:ExpReg.
- Set Xlist to L1 and Ylist to L2. To save the equation for graphing, set Store RegEQ to Y1 (VARS, Y-VARS, Function, Y1). Then choose Calculate.
- Read off and in .
The calculator needs every output to be positive. If the data level off at some value other than 0, subtract that value first, run the regression, and then add it back.
Example 5: Electric vehicles
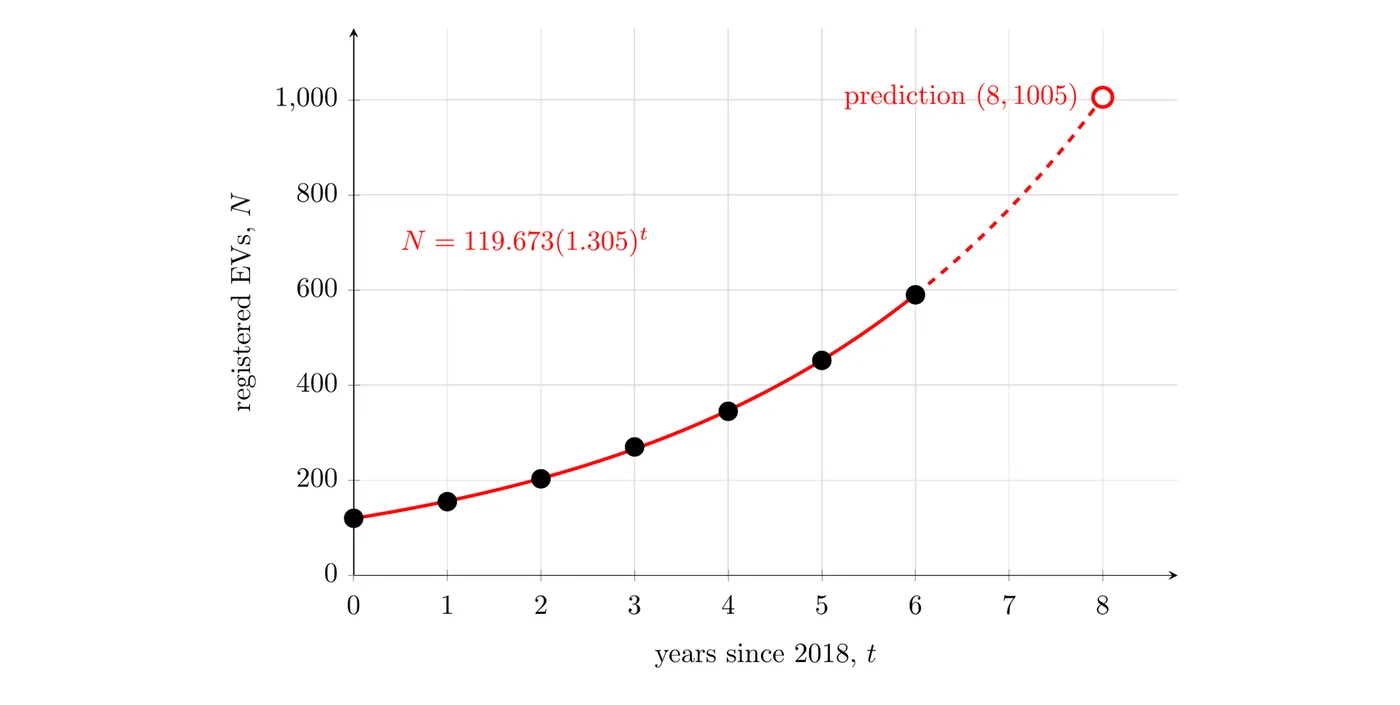
The table shows made-up data for the number of electric vehicles registered in a town years after 2018.
0 | 1 | 2 | 3 | 4 | 5 | 6 | |
120 | 155 | 203 | 270 | 345 | 452 | 590 |
(a) Explain why an exponential model is reasonable.
The ratios of consecutive values are , , , , , and . They're all close to 1.3, so the data are roughly proportional over equal 1-year intervals.
(b) Find the exponential regression.
ExpReg gives and , so
(c) Interpret in context.
The number of registered electric vehicles is multiplied by about 1.305 each year, so it grows by about 30.5% per year.
(d) Predict the number of electric vehicles in 2026, and comment on the prediction.
2026 is . Using the stored regression equation, vehicles. That's a short extrapolation (2 years past the data), so it's fairly reasonable. Predicting much further out is risky, since 30% yearly growth can't continue forever in one town.
The natural base
Many models in science and finance use the natural base , often in the form . For this course you just need to use it like any other base. On a TI-84, is 2nd, LN.
To find the growth factor per unit, use the power property:
For example, if a town's population is , then , so the population grows by about 4.08% per year.
Using a model: Predictions and domain
Once you have a model, you can use it two ways:
- Predict an output: plug in an input, like or .
- Find an input: find when the model reaches a value, like when . For now, use a graph or table on your calculator. Logarithms (Topic 2.13) let you do it by hand.
Always think about the contextual domain. Times before the data starts may not make sense, counts of people or cars should be whole numbers, and growth can't continue forever. A prediction far outside the input values of the data is an extrapolation, and AP questions often ask whether a prediction is reasonable. Answer with a reason tied to the context.
Give every answer with units and in context. Write "the coffee is about 112.3°F after 30 minutes," not just 112.3.
Common mistakes
- Using the rate as the base. A 6% growth rate gives , not or .
- Getting decay backwards. A 15% loss gives , not or .
- Adding percents across periods. 15% per year for 4 years is not a 60% loss. Multiply instead: , which is a 47.8% loss.
- Rounding too early. Store full values of and , and round only the final answer.
- Forgetting the shift. If a quantity levels off at a nonzero value (like room temperature), the model needs that constant: .
- Answering without context. Include units, and say what the number means in the situation.