

3.1 - Periodic Phenomena
Overview
Lots of things in the real world repeat: the height of a seat on a Ferris wheel, ocean tides, the hours of daylight over a year, the pressure in your arteries with each heartbeat. A periodic relationship is one where the outputs repeat the same pattern again and again as the inputs increase. This topic is about recognizing that repetition, sketching it from a verbal description, and describing it with precise language. It sets up all of Unit 3, because sine and cosine are the periodic functions we use to model these situations.
What makes a relationship periodic
A relationship between two quantities is periodic if, as the input increases, the output repeats the same pattern over successive equal-length intervals. That definition has two parts, and both matter:
- The pattern repeats exactly. Every interval shows the same outputs in the same order: the same highs, the same lows, the same shape.
- The intervals have equal length. Each repetition takes the same amount of input (the same amount of time, the same angle, the same distance).
Context | Input | Output | Length of one cycle |
Ferris wheel | time | height of a seat | time for one revolution |
Tides at a dock | time | water depth | about 12.4 hours |
Daylight in a city | day of the year | hours of daylight | about 365 days |
Heartbeat | time | blood pressure | about 0.8 seconds at 75 beats per minute |
Not periodic: a bouncing ball whose bounces get lower each time. Its height goes up and down, but the outputs don't repeat, because each peak is smaller than the last. A swing that slows down is the same story. For a periodic relationship, the values themselves have to come back, not just the up-and-down motion.
Building a graph from one cycle
A cycle is one complete run of the pattern. Once you know what one cycle looks like, you know the whole graph: copy that cycle and place the copies end to end, to the right and to the left.
- Read the description and list what happens during one cycle, in order.
- Find how long one cycle lasts along the input axis.
- Sketch that one cycle carefully: the starting value, the highs and lows, and any flat stretches.
- Repeat the cycle on each following interval of the same length. The end of one cycle is the start of the next.
Example 1: Graphing from a verbal description
A pump fills a tank from 2 gallons to 10 gallons at a constant rate over 3 minutes. The tank holds 10 gallons for 1 minute. Then it drains at a constant rate back down to 2 gallons over the next 2 minutes, and the pump immediately starts filling again. The pattern repeats all day. Let be the volume in gallons minutes after the pump first starts filling. Sketch for .
Step 1: Describe one cycle.
- From to : rises in a straight line from 2 to 10 (constant rate).
- From to : stays at 10.
- From to : falls in a straight line from 10 to 2.
Step 2: Find the length of one cycle. minutes.
Step 3: Sketch one cycle, then copy it. The cycle on repeats on and on .
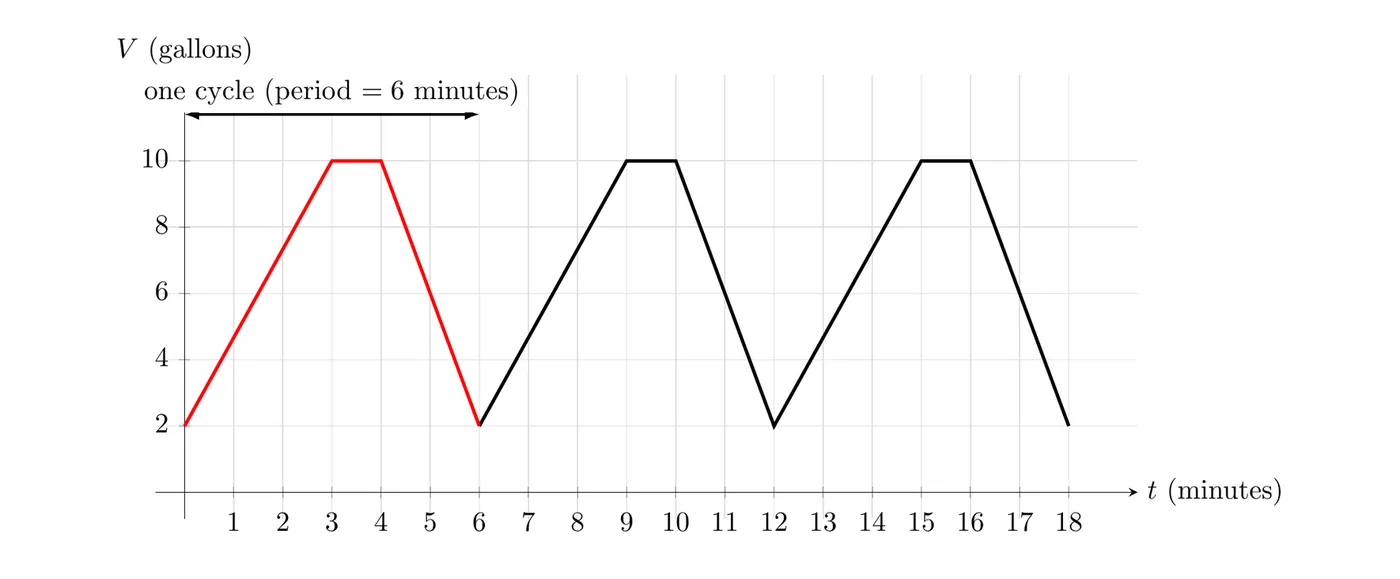
The red piece is one cycle. The black pieces are exact copies of it, moved 6 and 12 minutes to the right.
Rates of change: while the tank fills, the rate of change is gallons per minute, and while it drains, it is gallons per minute. These rates repeat in every cycle too.
The period
The period of a periodic function is the smallest positive number such that
In words: from any input, move units to the right and you land on the same output. The period is the length of one cycle. For the tank, minutes.
Why the word smallest? If for every , then and too. Every multiple of the period also works, so the period is defined as the smallest one.
Why the period is so useful
Because the pattern repeats every units, one interval of that width tells you everything about the function. The interval doesn't have to start at 0 or at a high point. For the tank, shows one full cycle, but so do and .
It also means adding or subtracting the period any number of times never changes the output:
Example 2: Using the period to find values
Use the tank from Example 1, which has a period of 6 minutes. Find , , and , and explain what means in context.
Idea: subtract whole periods until the input lands in the first cycle, , where we know the formula for each piece.
Finding V(20): , so . At the tank is filling. It started at 2 gallons and gains gallons per minute:
Finding V(45): , so .
Finding V(53): , so . At the tank has been draining for 1 minute at 4 gallons per minute:
Answer: gallons, gallons, and gallons. In context, means that 45 minutes after the pump first starts, the tank holds 10 gallons. A new cycle started at , so at the tank has just finished filling for the eighth time.
Estimating the period from data
With real data you usually don't have a formula, and measurements are a little noisy. To estimate the period:
- Look at the outputs in order and find where the whole sequence of values starts over, not just where one value shows up again.
- Check that the next stretch of outputs matches the first stretch, value by value (roughly, since real data has small errors).
- The distance along the input axis from the start of one stretch to the start of the next is your estimate of the period.
Example 3: Estimating the period from a table
A sensor records the water depth , in feet, at a dock every 2 hours.
Time (hours) | Depth (feet) |
0 | 3.0 |
2 | 3.8 |
4 | 5.2 |
6 | 6.0 |
8 | 5.3 |
10 | 3.7 |
12 | 3.0 |
14 | 3.7 |
16 | 5.3 |
18 | 6.0 |
20 | 5.2 |
22 | 3.8 |
24 | 3.0 |
Estimate the period of , and describe where increases and decreases during one cycle.
Step 1: Don't stop at the first repeated value. at both and , but that isn't a full cycle. The depth is falling at and rising at .
Step 2: Find where the whole pattern starts over. From to the depths are 3.0, 3.8, 5.2, 6.0, 5.3, 3.7. Starting at , they are 3.0, 3.7, 5.3, 6.0, 5.2, 3.8. That's the same pattern (low, up to about 6, back down), with each value within 0.1 foot of its partner 12 hours earlier.
Answer: The period is about 12 hours, so this tide pattern repeats roughly twice a day. In each cycle, the depth increases from about 3 feet at to about 6 feet at , then decreases back to about 3 feet at . (Real tides have a period closer to 12.4 hours. Readings every 2 hours can only give an estimate.)
Every period has the same characteristics
A periodic function can increase and decrease, be concave up or concave down, and have rates of change that speed up or slow down, just like the functions in Unit 1. The difference is that whatever happens in one period happens in every period. If has period :
- If is increasing on , it is also increasing on , on , on , and so on.
- If has a maximum value at , it has the same maximum value at for every integer .
- Intervals of concave up and concave down, and the points of inflection between them, repeat the same way.
- The average rate of change over any full period is 0, because :
Example 4: The Ferris wheel (AP-style)
A Ferris wheel has a diameter of 40 meters, and its center is 25 meters above the ground. It turns counterclockwise at a constant speed and completes one revolution every 8 minutes. A rider boards at the lowest point at time . Let be the rider's height above the ground, in meters, minutes after boarding.
(a) Sketch for . (b) Find the period, and the maximum and minimum heights with the times in when they happen. (c) Describe where is increasing, decreasing, concave up, and concave down, and explain why using the motion of the wheel. (d) Is changing faster at or at ?
Part (b) first, since it gives the points for the sketch. The radius is meters.
- Lowest point: meters, at .
- Highest point: meters, half a revolution later, at .
- Level with the center (25 meters): a quarter revolution after boarding, at , and again on the way down at .
- Back at the bottom at , when one revolution is complete.
So the period is 8 minutes. In the rider makes three full trips: the maximum height of 45 meters happens at , and the minimum height of 5 meters happens at .
Part (a): sketch one cycle through those points, then repeat it.
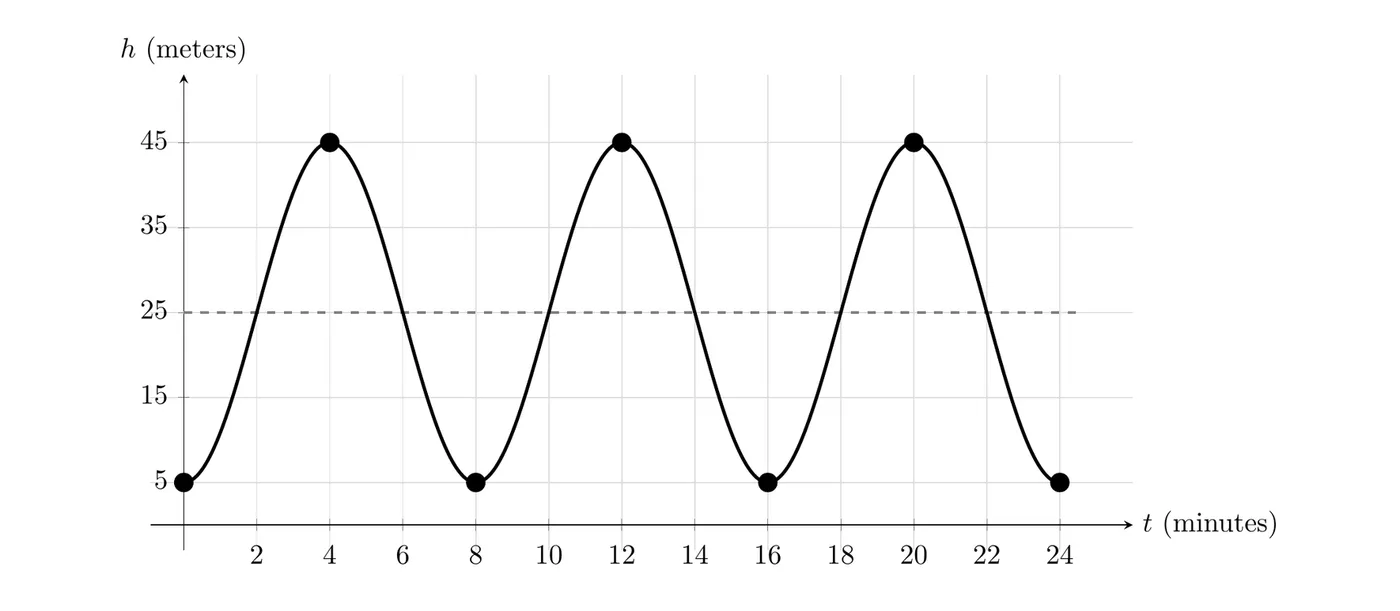
The dashed line marks the height of the center, 25 meters.
Part (c), increasing and decreasing: in the first cycle, increases on while the rider goes up and decreases on while the rider comes down. Repeating with period 8, is increasing on , , and , and decreasing on , , and .
Part (c), concavity: near the bottom and the top of the wheel, the rider moves mostly sideways, so the height changes slowly. Near the level of the center, the rider moves almost straight up or down, so the height changes quickly. Follow the rate of change through one cycle:
- On , is increasing and its rate of change is increasing (rising faster and faster), so the graph is concave up.
- On , is increasing but its rate of change is decreasing (rising more and more slowly), so the graph is concave down.
- On , is decreasing and its rate of change keeps decreasing (falling faster and faster), so the graph is still concave down.
- On , is decreasing but its rate of change is increasing back toward 0 (falling more and more slowly), so the graph is concave up.
Concavity changes at , the times when the rider is level with the center. Over , is concave down on , , and , and concave up on , , , and .
Part (d): at the rider is level with the center, moving straight up, which is when the height changes fastest. At the rider is close to the top and moving mostly sideways.
Answer: (b) The period is 8 minutes, with a maximum of 45 meters at and a minimum of 5 meters at . (d) The height is changing faster at . Later in this unit you'll write an equation for using cosine.
Common mistakes
- Calling the first repeated value the period. One matching output isn't enough. The whole pattern has to start over (Example 3).
- Giving a multiple of the period. If the pattern repeats every 6 minutes, it also repeats every 12, but the period is the smallest repeat length, 6.
- Thinking a cycle must start at a high or low point. Any interval one period wide is a full cycle.
- Copying the shape but not the values. Every copy of the cycle has its highs, lows, and flat parts at the same heights as the original.
- Calling something periodic when its peaks shrink or grow, like a bouncing ball. The outputs have to repeat, not just the up-and-down motion.