

3.14 - Polar Function Graphs
Overview
A polar function takes an angle as its input and gives a radius as its output. Plotting all of those pairs draws curves that would be messy to write with and , like circles through the origin, roses, and limaçons. The key skill is connecting the ordinary graph of versus to the curve it draws in the polar plane.
What the graph of a polar function shows
The graph of is every point with polar coordinates . Each input is an angle measured from the polar axis, and each output is a signed radius.
Picture a ray spinning counterclockwise around the origin as increases. At each angle, tells you where the point sits on the line through that ray: units out along the ray if it's positive, or units in the opposite direction if it's negative.
- A change in the input is a change in angle, so the point moves to a different ray.
- A change in the output is a change in signed radius, so the point moves toward or away from the origin along the line.
- An output of 0 puts the point at the origin, whatever the angle.
Example 1: Graphing from a table
Make a table of values for and plot the points.
Where the point is | ||
4 units along the polar axis: | ||
on the ray: | ||
the origin | ||
opposite the ray, in Quadrant IV: | ||
opposite the ray, back at |
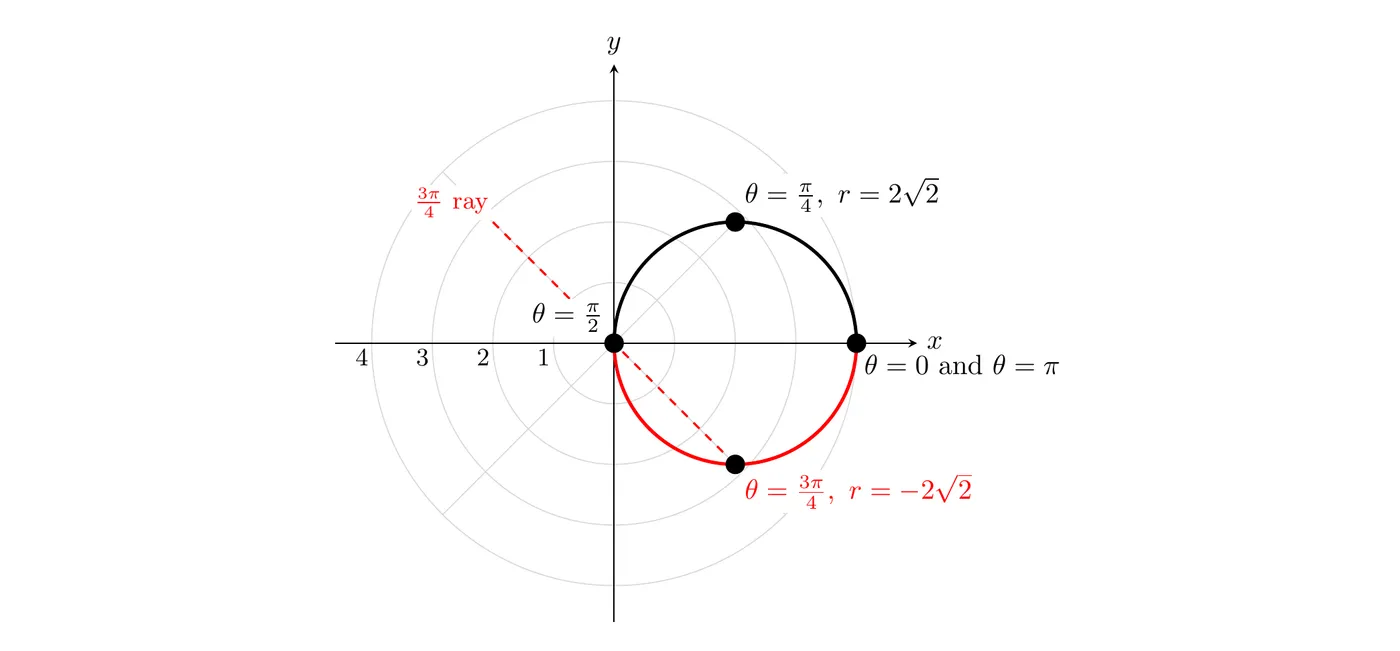
For , is positive and the point sweeps along the top half of a circle, from into the origin (black). For , is negative, so each point lands on the opposite side of the origin, and the bottom half gets drawn (red).
The graph is a circle with center and radius 2, traced once for . As continues from to , the same circle is traced again. (Multiplying both sides by gives , which is , or in rectangular form.)
From the graph of versus to the polar graph
AP questions often show the graph of on ordinary axes, with on the horizontal axis and on the vertical axis, then ask about the polar curve. Read that graph from left to right. At each angle, ask two questions: how big is , and is it positive or negative?
Example 2: The limaçon (AP-style)
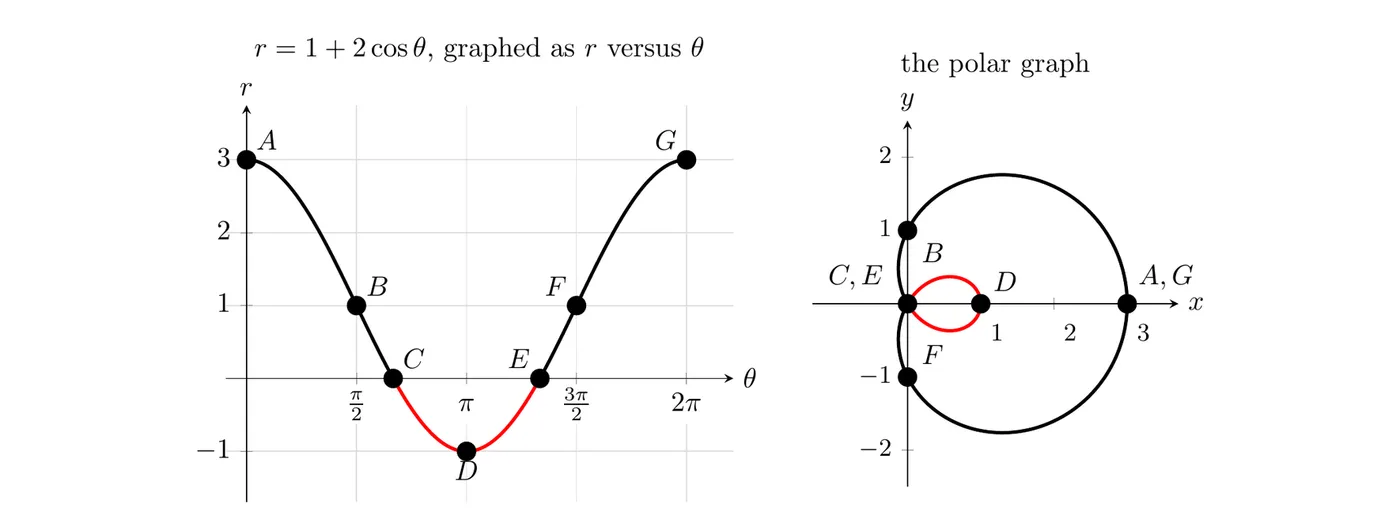
The figure shows graphed both ways, with matching points labeled. The red parts are where .
Point | Location in the plane | ||
, on the polar axis | |||
the origin | |||
, since a negative points opposite the ray | |||
the origin | |||
again |
Now follow the curve in three stages:
- A to C (): is positive and shrinks from 3 to 0. The point swings from up through Quadrants I and II and into the origin. This is the top of the big loop.
- C to E (): is negative. The rays point into Quadrants II and III, but the points are plotted on the opposite side, in Quadrants IV and I. This traces the small inner loop, and is its point farthest from the origin.
- E to G (): is positive again and grows from 0 to 3, tracing the bottom of the big loop through Quadrants III and IV back to .
This curve is called a limaçon with an inner loop. The inner loop exists only because goes negative.
Restricting the domain
To draw only part of a polar graph, choose an interval of whose endpoints are the angles where that part starts and stops. Find those angles from the radius you want at each end. Often the part starts or stops at the origin, so you solve .
Example 3: Tracing only the inner loop
For , give an interval of that traces just the inner loop.
The inner loop starts and ends at the origin, where :
Between these angles is negative (for example, at ), which is exactly the inner loop. Answer: .
Rose curves
Graphs of and , where is a whole number, are called roses. Each petal has length , the largest value of .
- If is odd, there are petals, and the whole rose is traced once for .
- If is even, there are petals, and it takes to trace them all.
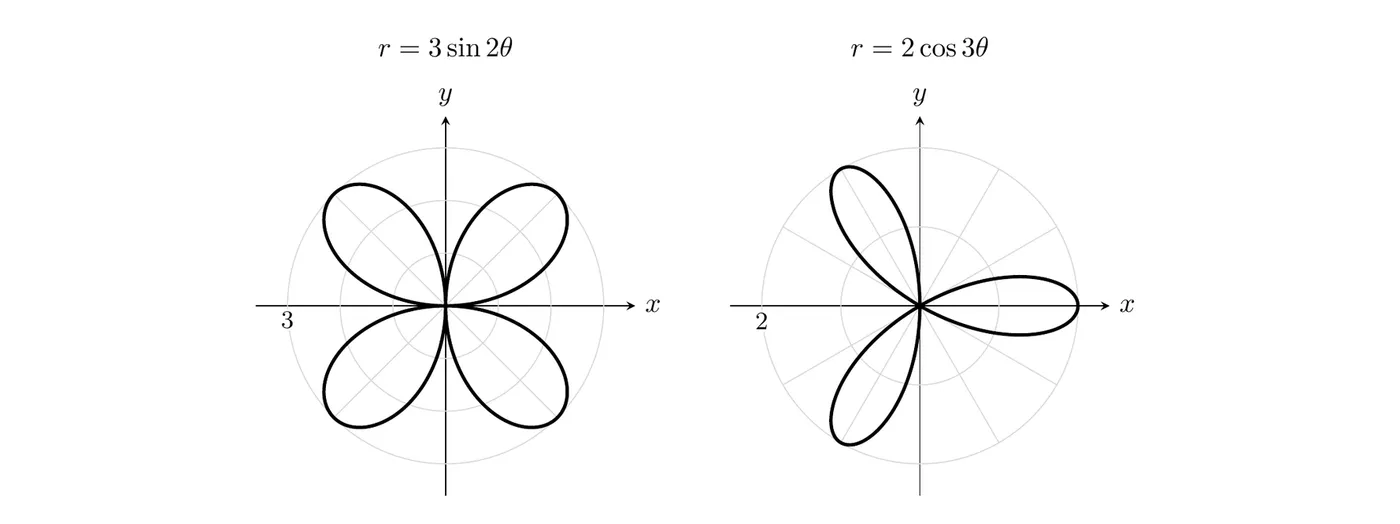
has , so it has 4 petals of length 3. has , so it has 3 petals of length 2, with tips in the directions , , and .
Example 4: Which angles trace which petal?
For , find an interval of that traces only the petal in Quadrant II.
Check the sign of on each quarter turn:
Interval | Sign of | Petal traced |
positive | Quadrant I | |
negative | Quadrant IV (opposite Quadrant II) | |
positive | Quadrant III | |
negative | Quadrant II (opposite Quadrant IV) |
Answer: . The obvious guess, , traces the Quadrant IV petal instead, because is negative there.
Common polar graphs
The CED doesn't require these names, but recognizing the shapes helps you check your work quickly.
Equation | Graph |
circle centered at the origin with radius | |
circle through the origin, centered at | |
circle through the origin, centered at | |
or | rose: petals if is odd, petals if is even |
or , with | limaçon: inner loop if , cardioid (heart shape) if , dimpled if , convex if |
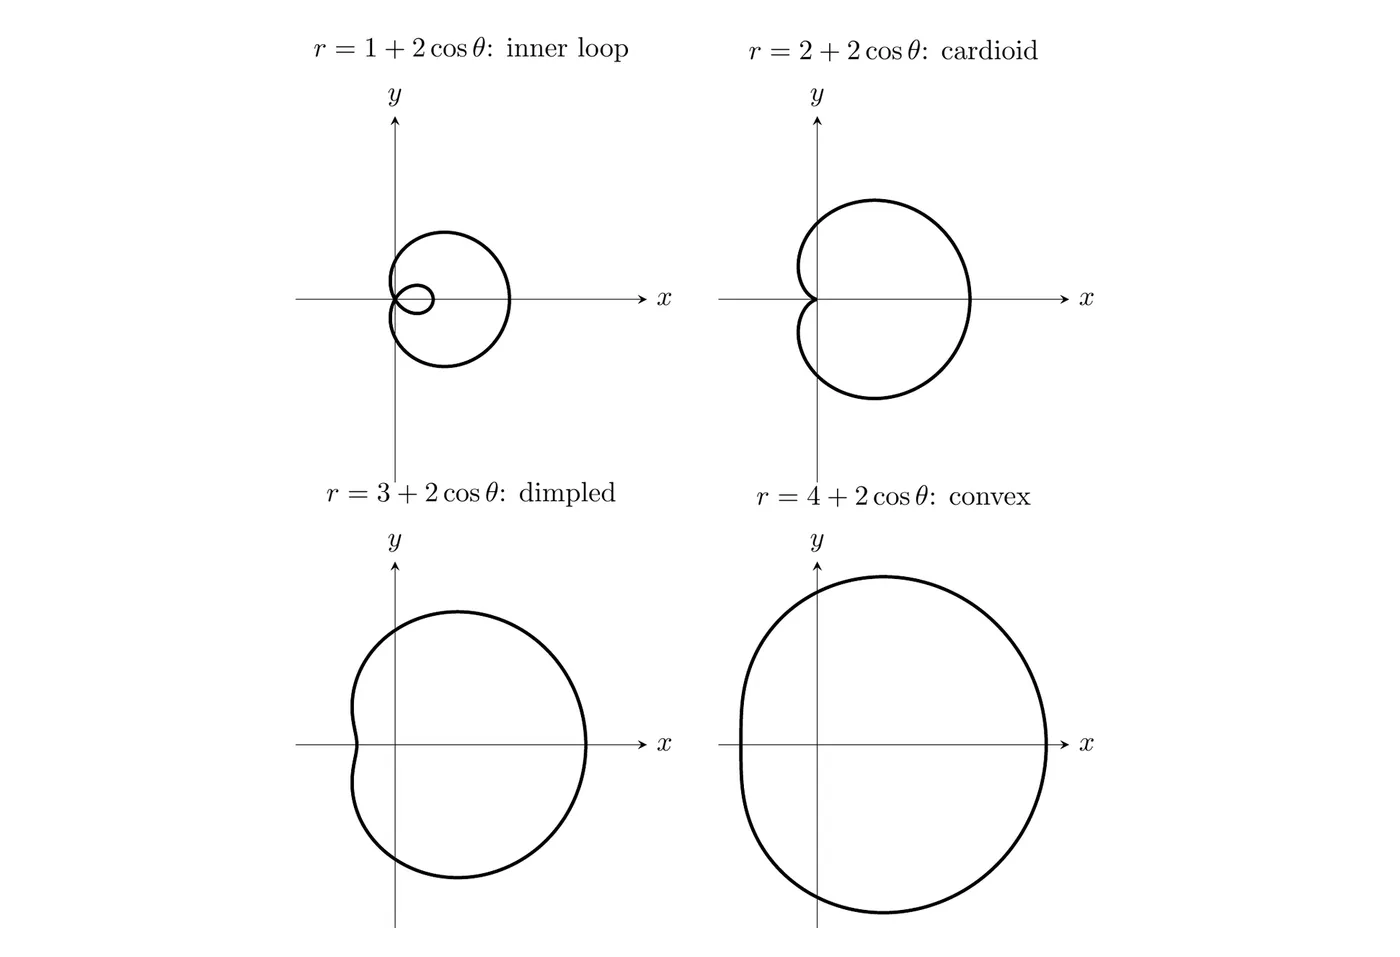
The four limaçons above all have and are drawn on the same scale. The cosine versions are symmetric about the x-axis. The sine versions are the same shapes turned to be symmetric about the y-axis.
Common mistakes
- Plotting a negative along the ray. A negative radius goes the opposite way, through the origin.
- Assuming you always need . Some graphs, like and , are fully traced by , and going further just retraces them.
- Miscounting rose petals. An even gives petals, not .
- Treating the graph of versus as a picture of the curve. It looks nothing like the polar graph. It's a tool for reading at each angle.