

3.7 - Sinusoidal Function Context and Data Modeling
Overview
Lots of things repeat: tides, Ferris wheels, hours of daylight, temperatures over a year. In this topic you'll build sinusoidal models for situations like these, either from a few key values or with a regression on your calculator, and then use the model to make predictions. Building a sinusoidal model from a context is exactly what Free-Response Question 3 (Modeling a Periodic Context) asks you to do on the AP exam.
The model
We'll write models in either form, where is usually time:
To build one, you need four numbers, and each comes from a different piece of information about the situation.
Period and frequency from maxima or minima
The period is the input distance between two consecutive maximums (or two consecutive minimums). That's the smallest interval over which the pattern starts repeating.
- If high tide is at 2 a.m. and the next high tide is at 2 p.m., the period is 12 hours.
- A maximum to the next minimum is only half a period, so double that distance.
Once you have the period, you can find and the frequency:
Frequency counts cycles per unit of input. A Ferris wheel with an 8-minute period turns of a revolution per minute.
Amplitude and midline from the max and min
The amplitude is half the distance from the lowest output to the highest. The midline is their average: the value the function oscillates around. If water depth at a dock ranges from 3 feet at low tide to 11 feet at high tide, then and .
Phase shift from an actual data point
The phase shift lines the model up with a real input-output pair. Pick the function whose starting point matches something you know:
If you know when... | Use | It starts its cycle at |
a maximum happens | a maximum | |
a minimum happens | a minimum | |
the output crosses the midline going up | the midline, increasing | |
the output crosses the midline going down | the midline, decreasing |
The cycle starts at , so set equal to the input you know. If a maximum happens at , use , which means .
Then check the model with a second known point, like a minimum. If it doesn't match, the most likely problem is the sign of .
Building a model step by step
- Find the maximum and minimum values. Compute and .
- Find the period from consecutive maximums or minimums (or double the max-to-min distance). Compute .
- Choose sine or cosine (and the sign of ) from a known point, and set the phase shift.
- Check a second point.
- Answer in context, with units.
Example 1: Ferris wheel
A Ferris wheel has a diameter of 50 meters, and its center is 30 meters above the ground. It makes one full revolution every 8 minutes. A rider boards at the lowest point at time . (a) Write a model for the rider's height , in meters, minutes after boarding. (b) Find the rider's height after 3 minutes. (c) When does the rider first reach 45 meters?
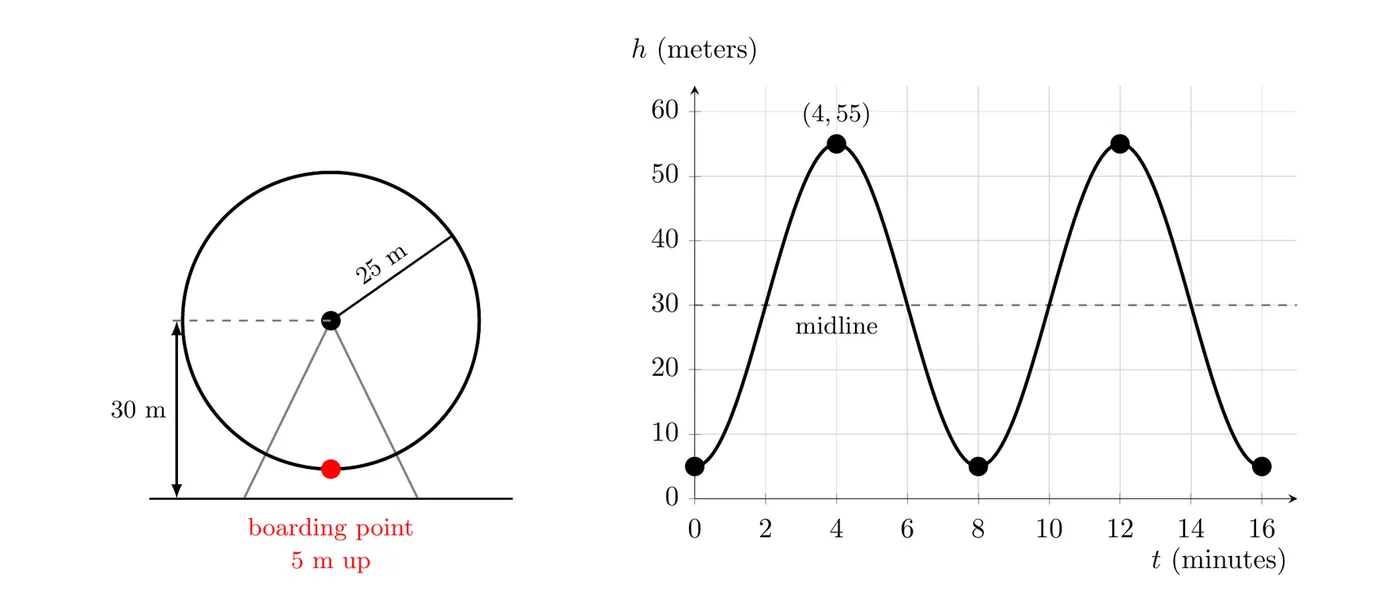
Step 1: Max and min. The radius is 25 m, so the highest point is m and the lowest is m.
Step 2: Period. One revolution takes 8 minutes.
Step 3: Phase shift. The rider starts at the minimum when , and negative cosine starts at a minimum, so no shift is needed.
Step 4: Check. Halfway through the ride the rider should be at the top: . That matches.
(b)
(c) Graph and on a graphing calculator and find the first intersection: . (Topics 3.9 and 3.10 show how to solve this algebraically.)
Answer: . After 3 minutes the rider is about 47.7 meters up, and the rider first reaches 45 meters about 2.82 minutes after boarding.
An equivalent sine model is , since the rider crosses the midline going up at minutes.
Example 2: Tides (AP-style)
The depth of the water at a boat dock rises and falls with the tides. At 2 a.m. the water reaches its maximum depth of 11 feet. Six hours later, at 8 a.m., it reaches its minimum depth of 3 feet, and the pattern repeats. The sinusoidal function models the depth, in feet, hours after midnight. (Real tides repeat about every 12.4 hours; this made-up example rounds to 12.)
The figure shows two full cycles of , starting at 2 a.m., with the midline dashed and no scale. Five points, through , are labeled.
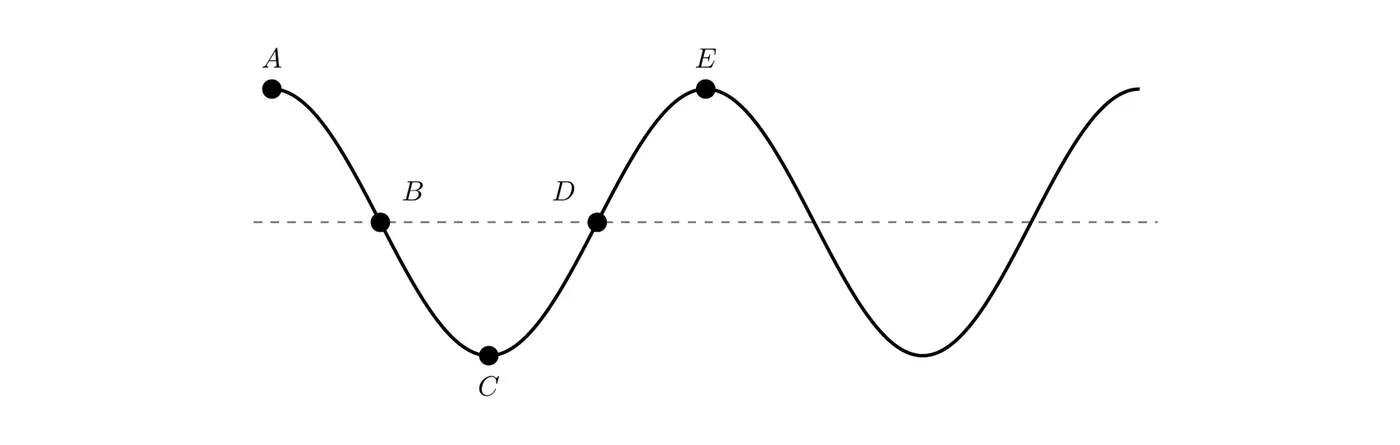
(A) Find the coordinates of points through . (B) The function can be written as . Find values of , , , and . (C) On the interval from to , is increasing or decreasing? Is the graph concave up or concave down? Is the rate of change of increasing or decreasing? (D) Use the model to find the depth at 6:30 a.m.
(A) is the maximum at 2 a.m.: . is the minimum at 8 a.m.: . A maximum to the next minimum is half a period, so the period is hours, and the next maximum is at . The midline is , and the midline crossings sit halfway between: and .
(B) Amplitude and midline:
Period 12 hours:
Sine starts on the midline going up. The graph crosses the midline going up at , , and also one period earlier, at . Setting gives .
Check with : . That matches. (Other values of , such as , also work, since they shift by a whole period.)
(C) From to , the depth drops from the midline to the low tide, so is decreasing. The graph bends upward as it levels off into the minimum, so it is concave up. On a concave up interval the rate of change is increasing: is still dropping, but more and more slowly, until the rate reaches 0 at . Compare to , where is decreasing and concave down, so it drops faster and faster.
(D) 6:30 a.m. is .
Answer: at 6:30 a.m. the water is , or about 4.17 feet, deep.
Sinusoidal regression with technology
Real data never sits perfectly on a sine curve. With a data table you have two options: estimate , , , and from key values, as above, or let a calculator find the best-fitting sinusoid with a sinusoidal regression. On a TI-84:
- Press
STAT, choose1:Edit, and enter the inputs inL1and the outputs inL2.
- Press
STAT, arrow over toCALC, and chooseC:SinReg.
- Set
XlisttoL1andYlisttoL2, and store the result inY1so you can graph it. SelectCalculate.
- The calculator reports . In this form the calculator's is not the phase shift. Factor out : the phase shift is .
Desmos and other graphing tools can run the same regression.
Example 3: Hours of daylight
The table shows the approximate number of hours of daylight on the 15th of each month in a city at about 40° north latitude, where is January.
(month) | 1 | 2 | 3 | 4 | 5 | 6 | 7 | 8 | 9 | 10 | 11 | 12 |
(hours) | 9.6 | 10.6 | 11.9 | 13.2 | 14.3 | 15.0 | 14.7 | 13.7 | 12.4 | 11.1 | 9.9 | 9.3 |
(a) Build a model from key values. (b) Compare it with a sinusoidal regression. (c) Use the regression to predict the hours of daylight on April 30.
(a) The maximum is 15.0 hours at and the minimum is 9.3 hours at .
The max and min are 6 months apart, which is half a period, so the period is 12 months and . The maximum is at , so use cosine shifted right 6:
(b) Running
SinReg on all 12 points gives approximatelyIts period is months, close to the 12 months we expect. Its phase shift is , so the regression's sine cycle starts (midline, going up) just after , in mid-March. Your calculator may show slightly different digits or an equivalent form; graph it to make sure it runs through the data.
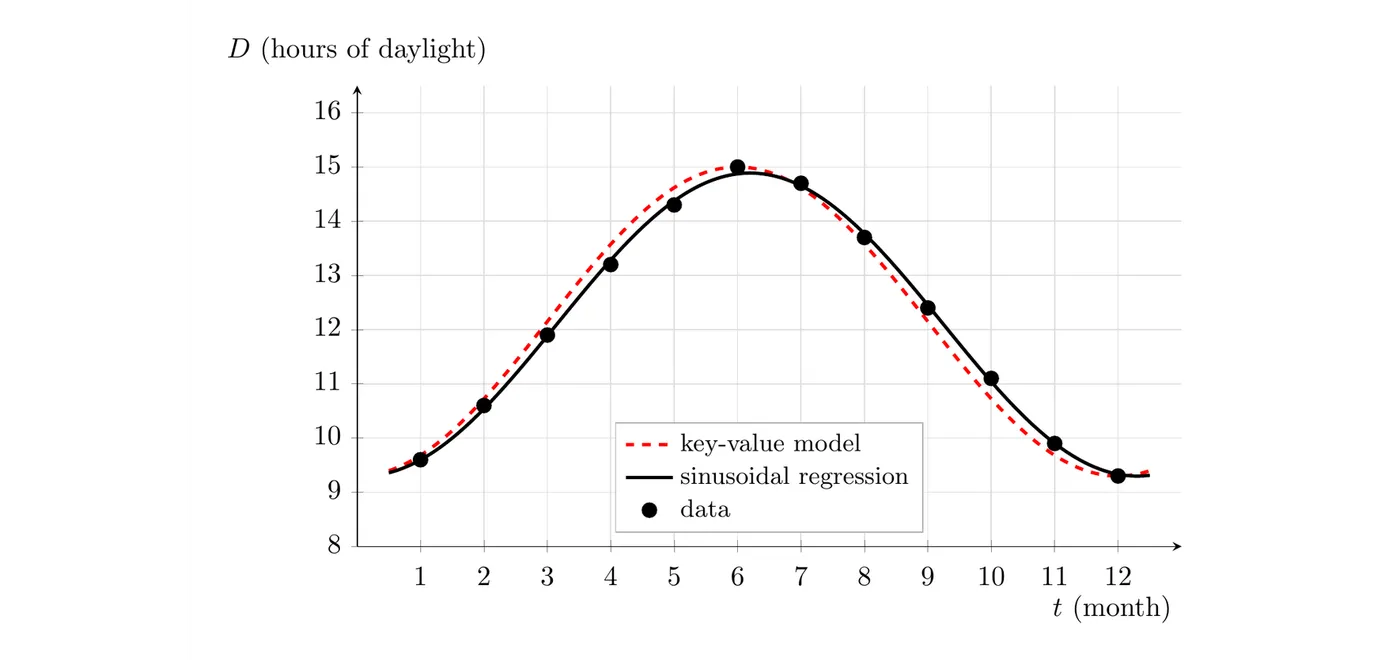
Both models fit well. The regression is a little closer at most points because it uses all 12 data points, while the key-value model uses only the max and the min.
(c) April 30 is halfway between April 15 () and May 15 (), so use :
Answer: the regression predicts about 13.9 hours of daylight on April 30.
Using a model in context
Once you have a model, you can use it three ways:
- Predict an output from an input. Plug in , like the daylight on April 30.
- Find inputs from an output. Set the model equal to a value and solve, with a graphing calculator's intersect feature or with inverse trig functions (Topics 3.9 and 3.10).
- Describe the behavior. Where is it increasing or decreasing? Concave up or down? Is the rate of change increasing or decreasing?
A sinusoidal model is usually only useful over its contextual domain, the inputs where the situation makes sense. The Ferris wheel model describes the rider only during the ride. The tide model was built from one day, and real tides drift from day to day, so it shouldn't be trusted a month later. Before you trust an output, ask whether the input fits the real situation.
Common mistakes
- Using the distance from a maximum to the next minimum as the period. That's only half a period.
- Using the period as . The constant is .
- Copying the calculator's as the phase shift. In , the phase shift is .
- Choosing a starting function that doesn't match the known point. Sine starts on the midline, cosine starts at a maximum, and negative cosine starts at a minimum.
- Using a model far outside its contextual domain, or leaving units off the answer.
- Leaving the calculator in degree mode. These models use radians.