

3.6 - Sinusoidal Function Transformations
Overview
Every sinusoidal function is the graph of or after some shifting, stretching, or flipping. In this topic you'll learn exactly what each of the four constants in does to the graph. Then you can read the amplitude, period, phase shift, and midline straight off an equation, and write an equation from a graph. You'll use this in every periodic model for the rest of the unit, including Free-Response Question 3 on the AP exam.
The general form
A sinusoidal function is any function that can be written as
where , , , and are real numbers, , and . Each constant controls one feature of the graph. The constants and are multiplicative transformations (they multiply), and and are additive transformations (they add).
Why do sine and cosine follow the exact same rules? Because cosine is just sine shifted. From Topic 3.5, , so the cosine graph is the sine graph slid units to the left. Any transformation moves both graphs the same way.
Here is each transformation on its own. In every panel, the dashed red curve is the parent function and the black curve is the transformed function.
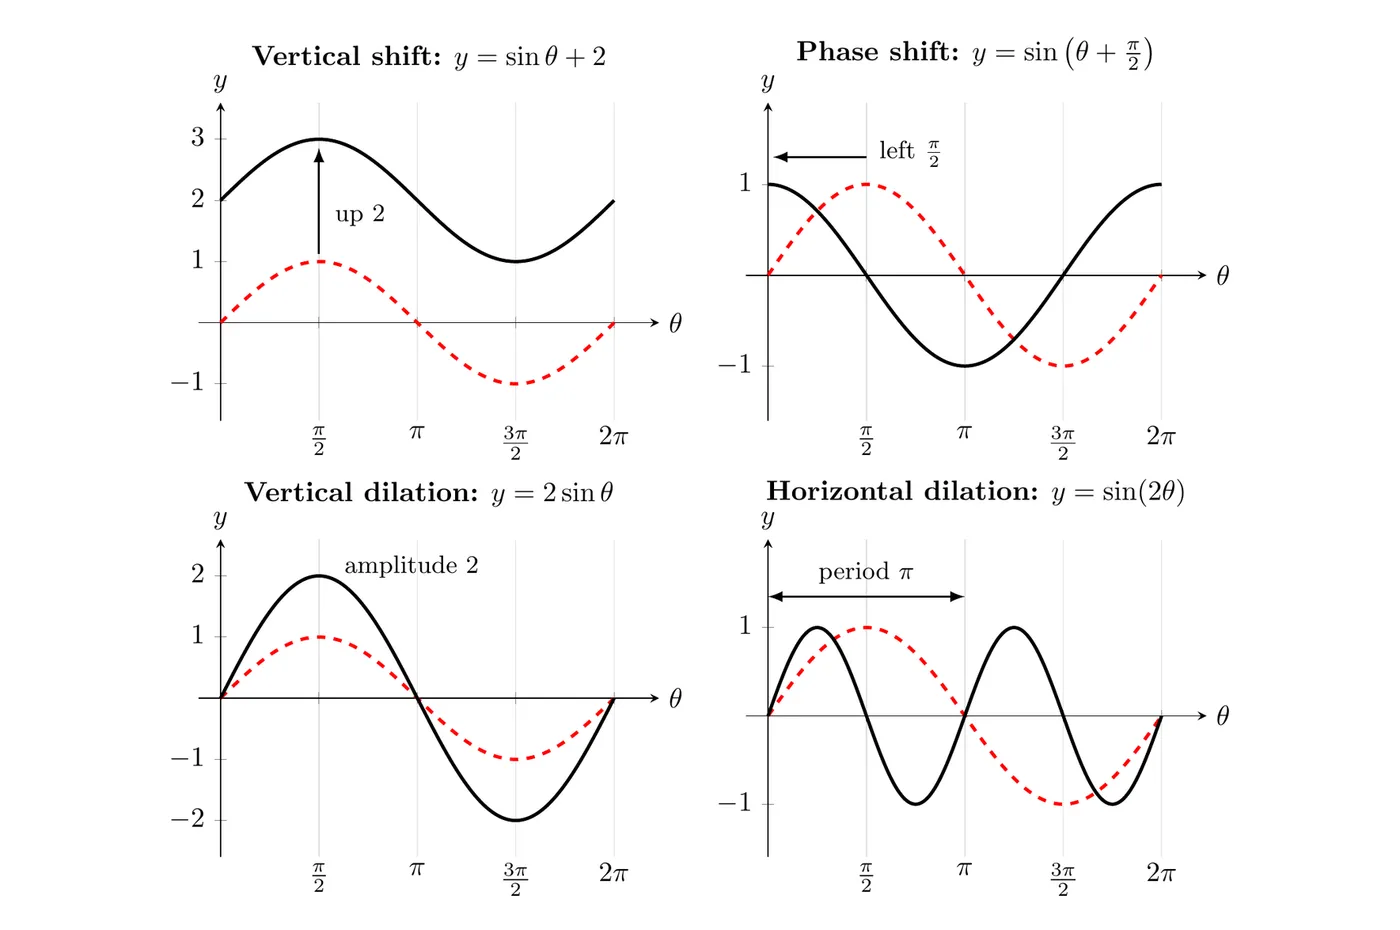
Vertical shift:
Adding a constant to the output moves the whole graph up or down:
- If , the graph moves up units. If , it moves down units.
- The midline moves with it. The midline of is , so the midline of is .
- The maximum and minimum move too. runs from to instead of from to .
Cosine works the same way: is the cosine graph moved down 4 units, with midline .
Phase shift:
Adding a constant to the input moves the graph left or right. This horizontal translation is called a phase shift.
The graph of is the graph of shifted units horizontally. The direction is the opposite of the sign you see:
- shifts left . Here , so .
- shifts right . Here , so .
Why backwards? Think about where a cycle starts. The parent starts a cycle (on the midline, going up) when its input is . For , the input is , which equals when . So the whole cycle now starts at .
The phase shift panel above shows : the sine graph moved left , which lands exactly on the cosine graph.
Vertical dilation:
Multiplying the whole function by stretches or compresses the graph vertically:
Every output is multiplied by , so the distance from the midline to a maximum changes from to . That distance is the amplitude, so the amplitude of is .
- If , the graph stretches taller. has amplitude 2.
- If , the graph compresses. has amplitude 0.5.
- If , the graph also reflects over its midline. has amplitude 3 (not ), and it goes down first from instead of up.
Amplitude is a distance, so it's never negative. Always use the absolute value.
Horizontal dilation:
Multiplying the input by squeezes or stretches the graph horizontally:
The parent sine finishes one cycle as its input goes from to . For with , the input reaches when . So the graph is a horizontal dilation by a factor of , and the period changes by that same factor:
- If , the graph is squeezed and the period is shorter. has period , so it fits two full cycles where fits one.
- If , the graph is stretched and the period is longer. has period .
- If , the graph also reflects over the vertical axis. You can rewrite it with a positive : because sine is odd, and because cosine is even.
Frequency is the reciprocal of the period (Topic 3.5), so has frequency : that many cycles per unit of input.
Putting it all together
Constant | What it does to the graph | Key feature |
Vertical dilation by a factor of (reflects over the midline if ) | Amplitude | |
Horizontal dilation by a factor of | Period | |
Horizontal translation | Phase shift of | |
Vertical translation | Midline |
The same table works for . Two more facts follow from it:
- The maximum value is and the minimum value is , so the range is .
- When and , one full sine cycle starts on the midline at and ends one period later, at .
Here is with every feature labeled. Its constants are , , , and .
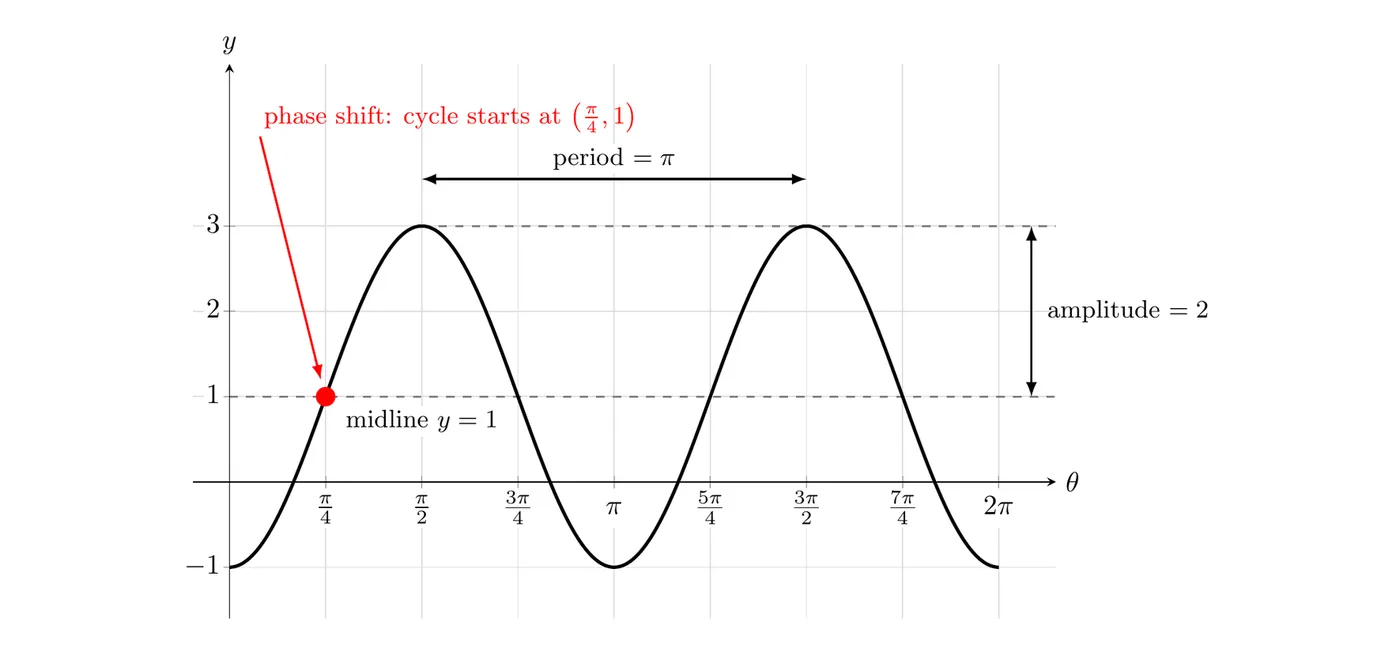
The amplitude is , the period is , the phase shift is to the right, and the midline is . A sine cycle starts on the midline going up, so this cycle starts at , reaches its maximum at , and the next maximum comes one period later, at .
Factor out first
This is the most common mistake in the topic. In , the phase shift is not . You have to factor out of the input first:
Now you can read , so the phase shift is (left ). Quick check: a cycle starts where the input is , and gives . That matches.
Sketching a sinusoid
To sketch by hand (with ), plot five key points per cycle:
- Draw the midline and the lines and .
- Find where a cycle starts: .
- Split one period into four equal parts, each long.
- For sine with , the five points go midline, max, midline, min, midline. For cosine with , they go max, midline, min, midline, max.
- If , swap every max and min.
Example 1: Reading an equation
Find the amplitude, period, phase shift, midline, and range of . Then find where reaches its maximum on .
Step 1: Factor out of the input.
So , , , and .
Step 2: Read the features.
- Amplitude: . Since , the graph is reflected over its midline.
- Period: .
- Phase shift: , so to the right.
- Midline: .
Step 3: Range: from to , which is .
Step 4: Because is negative, is at its maximum when the sine part equals :
Answer: amplitude 3, period , phase shift right, midline , range . On , the maximum value 4 happens at .
Example 2: Writing an equation from a graph
The graph of a sinusoidal function is shown. It has a maximum at , and the next minimum is at . Write an equation for .
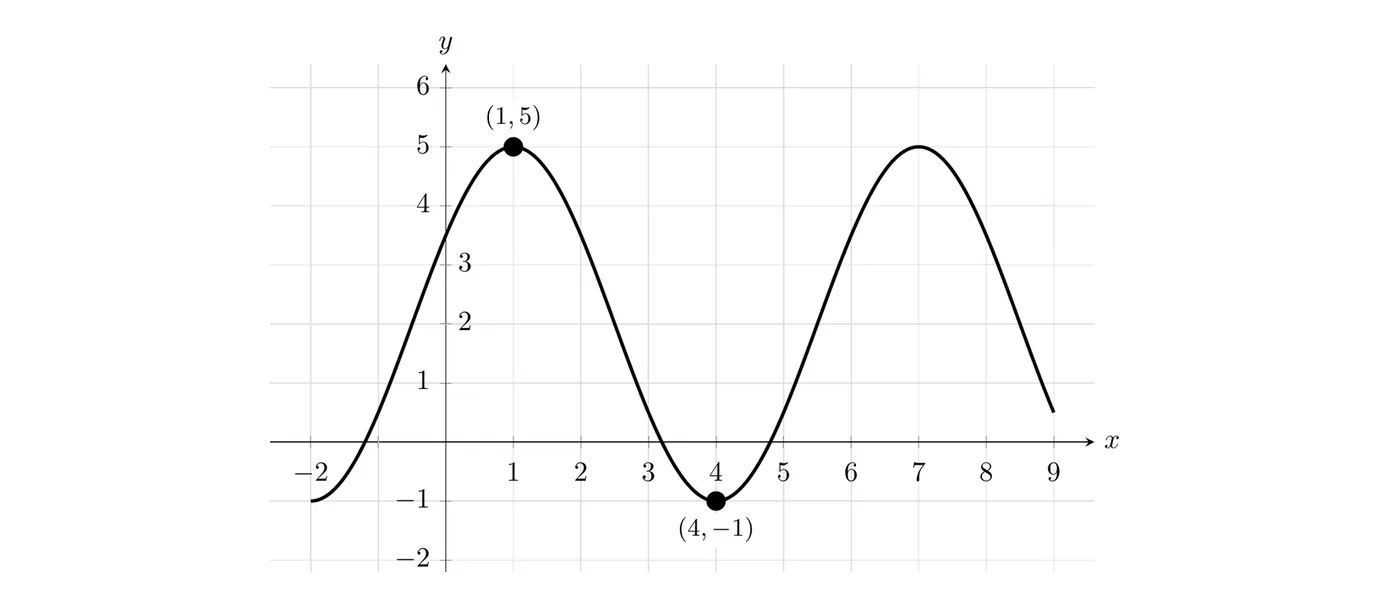
Step 1: Midline and amplitude from the max and min.
Step 2: Period. A maximum to the next minimum is half a period, so half the period is and the period is .
Step 3: Phase shift. Cosine starts a cycle at a maximum, and this graph has a maximum at , so shift cosine right 1.
Step 4: Check the minimum: . That matches.
Sine works too. Sine starts on the midline going up, halfway between a minimum and the next maximum. The minimum before is half a period earlier, at , so the graph crosses the midline going up at :
Both equations describe the same graph. In fact there are infinitely many correct answers, because you can shift by any whole number of periods.
Example 3: Transformations in words (AP-style)
The graph of is made from the graph of by these transformations, in this order: a horizontal dilation by a factor of , a horizontal translation units to the right, a vertical dilation by a factor of 4, and a vertical translation 1 unit down.
(a) Write an expression for . (b) Find the period and range of . (c) Find the smallest positive where has a maximum.
(a) A horizontal dilation by a factor of means , so : . Translating right means replacing with :
Then stretch vertically by 4 and move down 1:
Watch the translation step. . Writing instead would only shift the graph right .
(b) Period: . Range: from to , so .
(c) Cosine is at its maximum when its input is :
The maximum before that is one period earlier, at , which is negative. Answer: , with period , range , and its first positive maximum at .
Common mistakes
- Reading the phase shift before factoring out . Always rewrite as first.
- Getting the shift direction backwards. moves the graph left and moves it right (for ).
- Writing a negative amplitude. The amplitude is .
- Thinking a bigger means a longer period. It's the opposite: the period is , so a bigger packs in more cycles.
- Mixing up the midline and the horizontal axis. The midline is , the average of the max and min.