

3.4 - Sine and Cosine Function Graphs
Overview
In Topic 3.2, sine and cosine were coordinates of a point on the unit circle. Now we treat them as functions: the input is an angle and the output is a coordinate. Watching that point travel around the circle tells you exactly what the graphs of and look like and why they repeat. These two graphs are the starting point for every sinusoidal model in the rest of the unit.
The sine function
Take an angle in standard position and the point where its terminal ray meets the unit circle. The sine function, , gives the -coordinate of . That's the vertical displacement of from the -axis: positive when is above the axis and negative when it's below.
Domain: all real numbers. Every real number is an angle. Positive angles rotate counterclockwise, negative angles rotate clockwise, and angles past just keep going around. So is defined for every .
Tracing sine around the circle
Picture starting at and moving counterclockwise as increases. Its height changes like this:
As goes from | moves from | (height of ) |
to | up to | increases from to |
to | to | decreases from to |
to | down to | decreases from to |
to | back to | increases from to |
At the point is back where it started, and the whole pattern repeats. Plot the height of against and you get the sine graph. In the figure, the red segment on the circle (the height of ) is the same length as the red segment on the graph at that same .
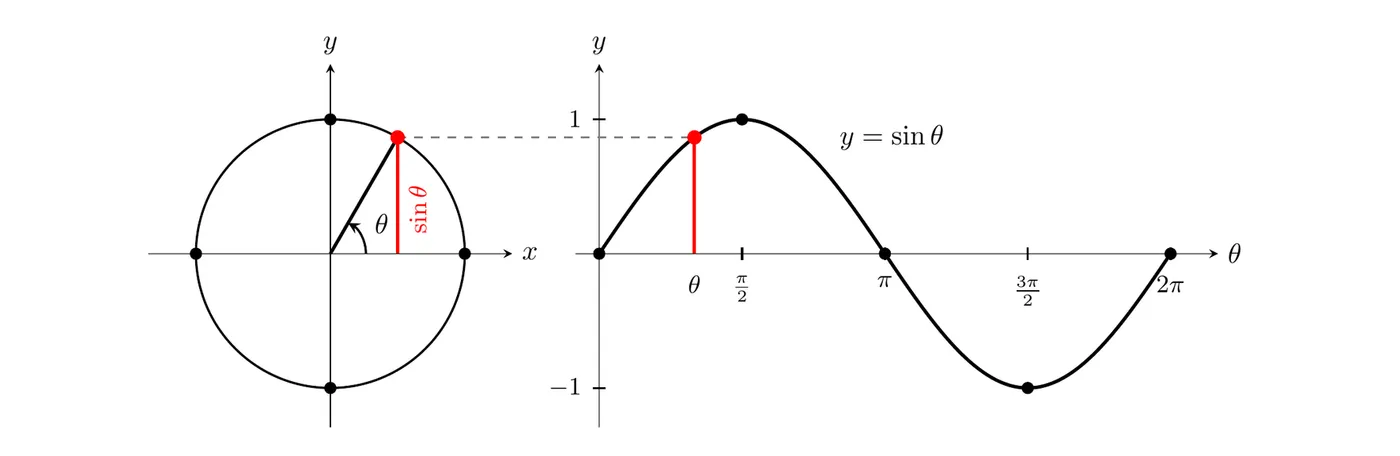
One more detail: on the unit circle, the arc from to has length exactly , because that's what a radian is. So the horizontal axis of the graph is the circle's edge unrolled into a straight line.
As the angle increases, the output oscillates between and . It can never go above 1 or below , because is on a circle of radius 1, and as moves around, its height passes through every value in between. So the range of sine is .
The cosine function
The cosine function, , gives the -coordinate of . That's the horizontal displacement of from the -axis: positive when is right of the axis and negative when it's left. Its domain is also all real numbers.
As moves counterclockwise from , its left-right position changes like this:
As goes from | (horizontal position of ) |
to | decreases from to |
to | decreases from to |
to | increases from to |
to | increases from to |
Cosine also oscillates between and and takes every value in between, so its range is too.
The graphs of sine and cosine
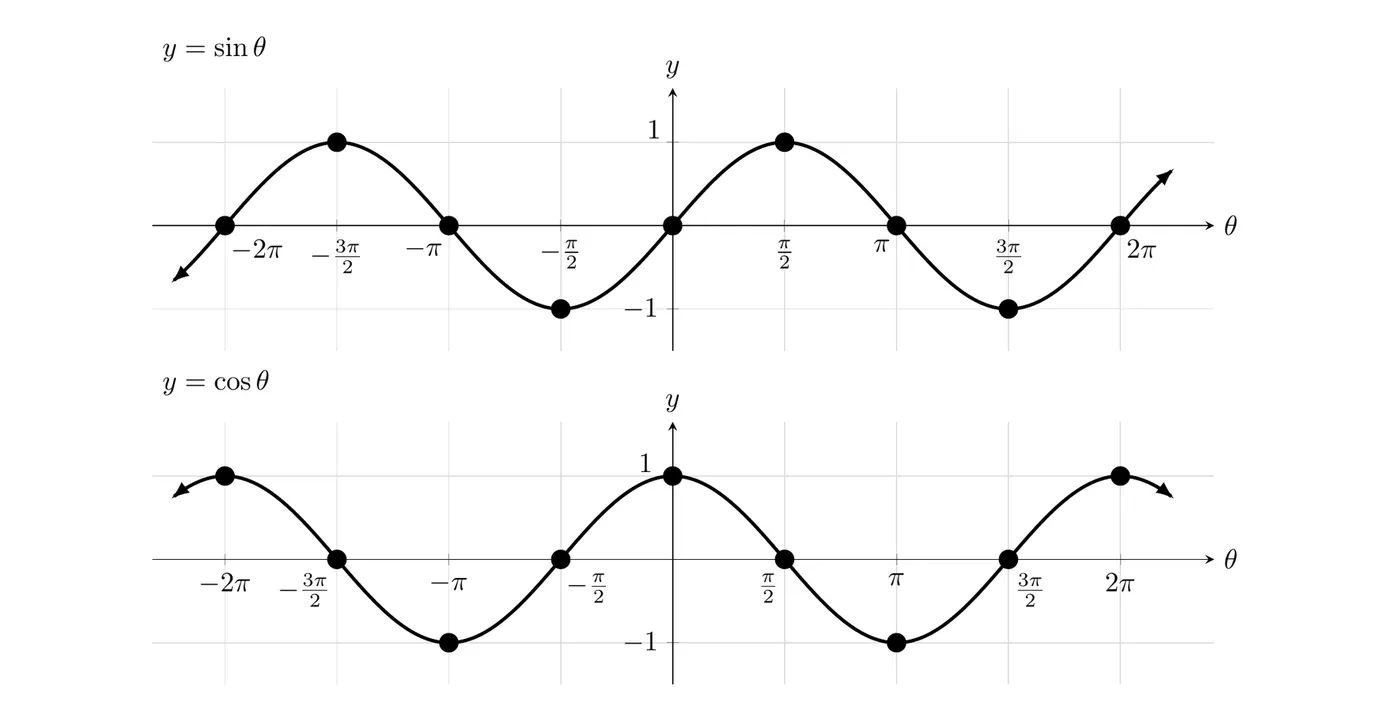
What to notice:
- Both graphs are smooth waves trapped between and .
- Both repeat every , because angles apart are coterminal and land on the same point .
- Sine starts at 0 and rises. Cosine starts at its maximum, 1, and falls. Both come from at .
- when is on the -axis, at . when is on the -axis, at . ( is any integer.)
- The two graphs have exactly the same shape. The cosine graph is the sine graph slid to the left (Topic 3.5 shows why).
To sketch more precisely, use the special values from Topic 3.3. For example, , so the sine graph passes through .
Example 1: Reading behavior from the circle
On the interval , where is increasing? Where is it negative?
Increasing: is the -coordinate of . From to , travels from down through and back to , moving to the right the whole time. Everywhere else in , it moves left.
Negative: is left of the -axis when it's in Quadrant II or III, which is when .
Answer: On , is increasing on and negative on . The graph agrees: it climbs from to and is below the axis between and .
Example 2: How many solutions?
(a) How many values of in make ? (b) Is there any with ?
(a) On the unit circle, the horizontal line crosses the circle at two points, one in Quadrant I and one in Quadrant II. On the graph, the line crosses the arch of the sine curve twice on and never on , where sine is negative. There are two values.
(b) No. Cosine is an -coordinate on the unit circle, so it's always between and . The value 1.2 is outside the range.
Example 3: Comparing values without a calculator (AP-style)
Without a calculator, put , , and in order from least to greatest. The inputs are in radians.
Step 1: Locate each angle. Use and .
- is in Quadrant I, about short of the top of the circle.
- is in Quadrant II, about past the top.
- is in Quadrant II, only about short of .
Step 2: Compare heights. All three points are above the -axis, so all three sines are positive. The highest point on the circle is at , and on , gets lower the farther its angle is from . Angle 2 is closer to than angle 1 is (0.43 versus 0.57), so . Angle 3 is almost at the -axis, so is close to 0.
Answer: . A calculator confirms it: , , and .
Common mistakes
- Confusing the two pictures. On the unit circle, is a horizontal position. On the graph , the horizontal axis is the angle and is the height of the graph.
- Mixing up the starting values. At , , so and .
- Thinking sine or cosine can be bigger than 1. Their outputs are coordinates on a circle of radius 1, so they always stay between and . Checking this catches a lot of impossible answers.
- Reading cosine's behavior from up-and-down motion. Sine tracks up and down. Cosine tracks left and right.
- Degree mode. In degree mode, means the sine of 2 degrees, about 0.035, not the sine of 2 radians.