

3.11 - Justifying a Claim Based on a Confidence Interval for the Difference Between Two Population Proportions
Overview
Topic 3.10 built a confidence interval for , the difference between two population proportions. This topic is about using it: interpreting the interval and the confidence level in context, and deciding whether the interval backs up a claim. Vague wording here is where many AP inference points get lost.
An interval can miss
The interval comes from two random samples, so it may or may not contain the true difference . A different pair of samples gives a different , and so a different interval. Most intervals built this way capture the true difference and a few don't, and with real data you never find out which kind you got.
What the confidence level means
The confidence level describes the method, not one particular interval. Here's the sentence the AP exam looks for:
In repeated random sampling with the same sample sizes from the same populations, approximately C% of the confidence intervals created will capture the difference between the two population proportions.
The figure shows this in action. Pretend we know the truth: and , so . One simulation took 25 pairs of random samples () and built a 95% interval from each pair. Each dot is one value of .
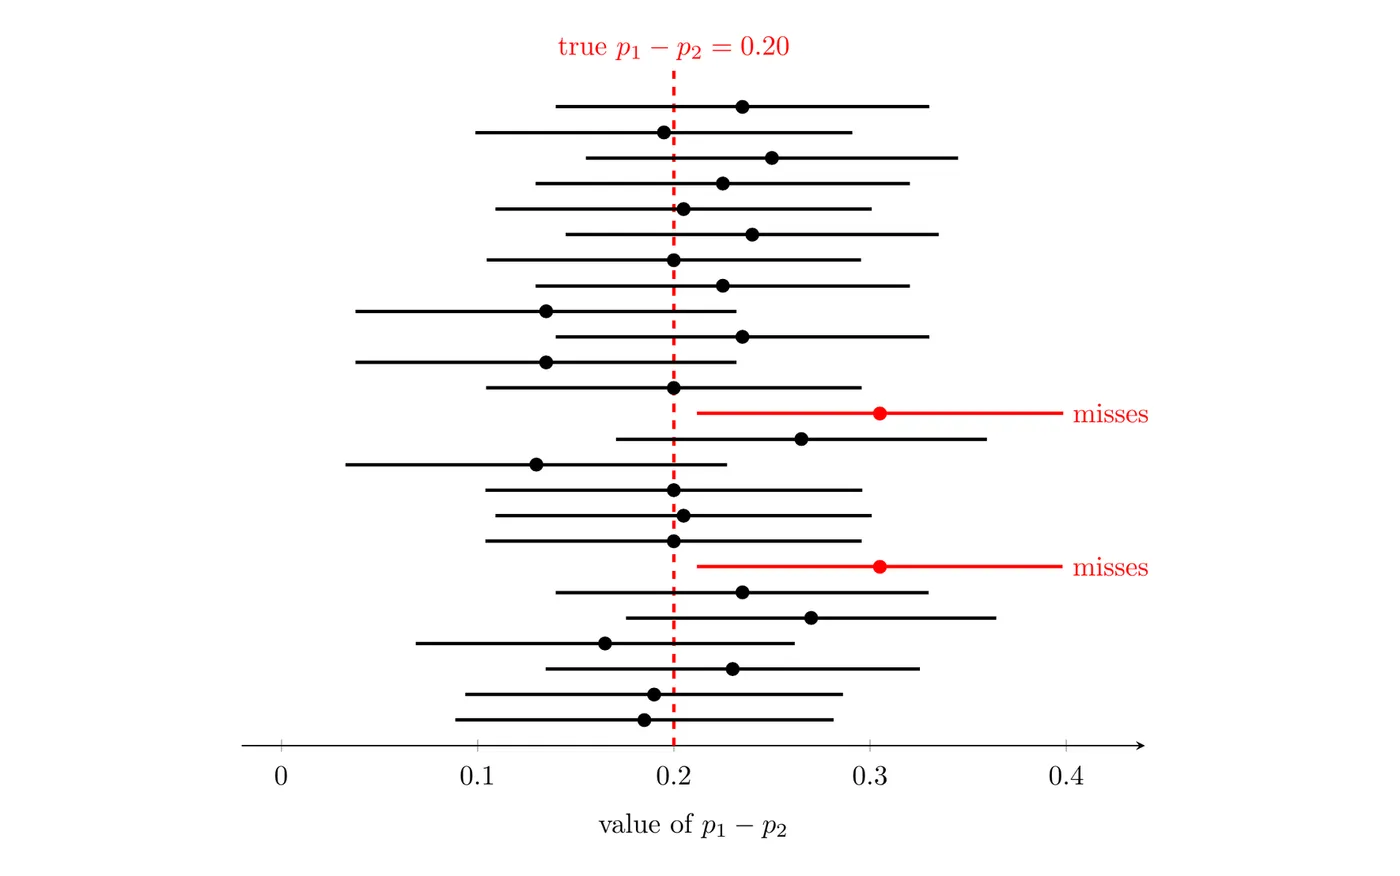
23 of the 25 intervals capture 0.20. The two red ones miss, because those samples happened to land unusually far above the truth. Over thousands of repetitions, about 95% would capture 0.20; in a small batch, the count bounces around.
For a randomized experiment, picture repeating the experiment many times, each time with a new random assignment: about C% of the resulting intervals would capture the true difference between the treatment proportions.
What the confidence level does not mean
- It is not the probability that one computed interval contains . Once you have numbers like and , the true difference is either in there or it isn't.
- It is not the percent of sample differences that land inside one interval.
Interpreting a confidence interval
To interpret a specific interval from to , use this template:
We are C% confident that the interval from a to b captures the true difference ([population 1] minus [population 2]) in the proportions of [the populations] who [response].
A full-credit interpretation has four parts:
- The confidence level, C%.
- The endpoints, and .
- The parameter: a difference between population (true) proportions, never sample proportions.
- The context: both populations (or treatments), the response variable, and the direction of subtraction.
The order of subtraction matters: a positive value means is larger, and a negative value means is larger. It also helps to say what the endpoints mean in plain words. For rural minus urban, says the rural proportion is plausibly 4.6 to 19.4 percentage points lower.
Using an interval to justify a claim
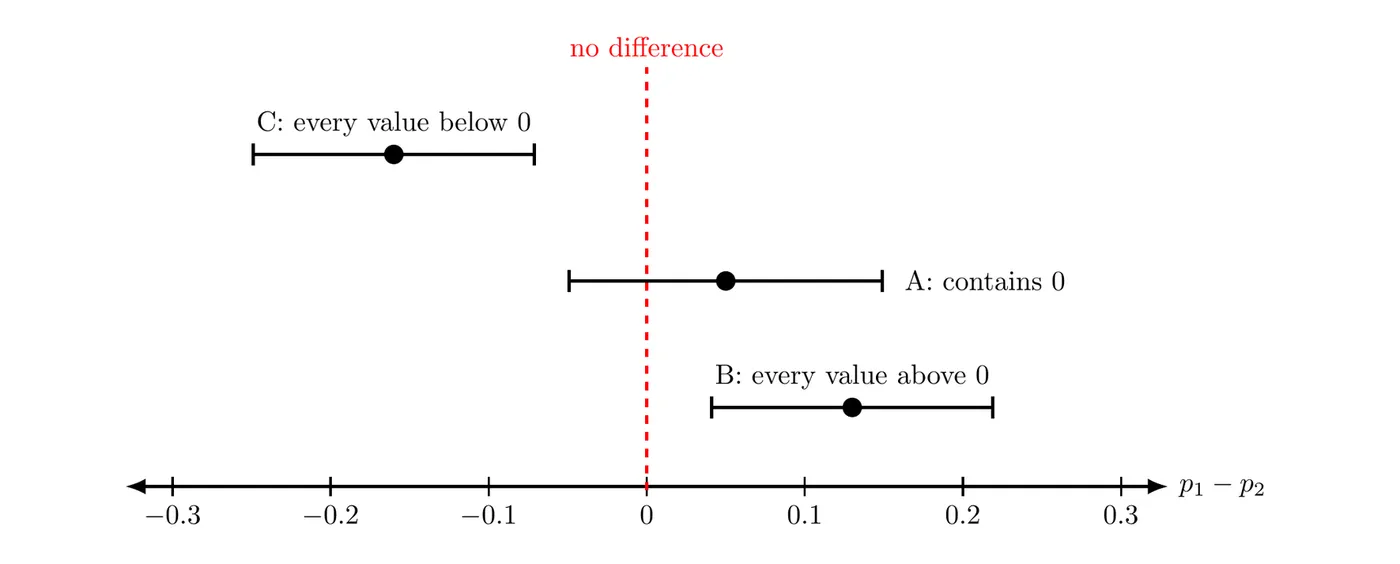
Think of the interval as a list of plausible values for . Values inside it are believable; values outside it are not, at that confidence level. To judge a claim, ask whether the interval includes the values the claim depends on. For a claim that there is any difference, the key value is 0, because means no difference.
What the interval looks like | What it says about | Conclusion |
Contains 0 (interval A) | 0 is a plausible value | Not convincing evidence of a difference between and |
Every value above 0 (interval B) | 0 is not plausible; every plausible value is positive | Convincing evidence of a difference, with |
Every value below 0 (interval C) | 0 is not plausible; every plausible value is negative | Convincing evidence of a difference, with |
0 inside the interval doesn't mean the proportions are equal. It means equal is one of many plausible values (interval A also includes 0.10). Say "not convincing evidence of a difference," never "the proportions are the same."
Claims about the size of a difference
The same logic handles claims like "at least 10 percentage points higher." Turn the claim into values of (here, ), then compare:
- If every value in the interval fits the claim, the interval gives convincing evidence for it.
- If some values fit and some don't, the claim is plausible but not supported. There isn't convincing evidence for it, and there isn't convincing evidence against it.
- If no value in the interval fits, there's convincing evidence that the claim is false.
Example 1: Library cards (AP-style)
In Topic 3.10, a state library system took a random sample of 300 rural adults and an independent random sample of 400 urban adults. Of these, 141 rural adults and 236 urban adults had a library card. The 95% confidence interval for was , where and are the true proportions of all rural and all urban adults in the state who have a library card.
- (a) Interpret the interval.
- (b) Interpret the confidence level.
- (c) A news story claims rural adults in the state are less likely than urban adults to have a library card. Does the interval support the claim?
- (d) A library advocate claims the rural proportion is at least 10 percentage points lower than the urban proportion. Does the interval support that claim?
(a) We are 95% confident that the interval from to captures the true difference (rural minus urban) between the proportion of all rural adults in the state who have a library card and the proportion of all urban adults in the state who have one. In words, the rural proportion is plausibly between 4.6 and 19.4 percentage points lower.
(b) If the library system took many random samples of 300 rural and 400 urban adults and built a 95% interval from each pair, about 95% of those intervals would capture the true difference .
(c) Yes. Every value in the interval is negative, so 0 (no difference) is not a plausible value. The interval gives convincing evidence that the proportion of rural adults in the state with a library card is lower than the proportion of urban adults.
(d) No. The claim says . The interval includes plausible values above , such as and , where the gap is less than 10 points. So the interval doesn't give convincing evidence for the advocate's claim. It doesn't rule the claim out either, since values from to are also plausible.
Example 2: Do reminder emails work?
Also from Topic 3.10: a dental clinic randomly assigned 360 volunteer patients who were overdue for a cleaning to get a reminder email (240 patients) or no reminder (120 patients). The 90% confidence interval for , the difference in the true proportions who book a cleaning within 30 days (email minus no reminder), was . The clinic claims that reminder emails increase the proportion of patients who book a cleaning. Does the interval support the claim?
Yes. The entire interval is above 0, so 0 is not a plausible value for ; every plausible value has the email group higher, by 6.3 to 23.7 percentage points. That's convincing evidence that the true proportion of patients like these who book a cleaning within 30 days is higher with a reminder email.
Because the reminders were randomly assigned, we can conclude they cause the increase. The patients were volunteers, not a random sample, so the conclusion applies to patients like the ones in this study.
Example 3: A new allergy spray (AP-style)
A drug company recruited 300 adult volunteers with seasonal allergies and randomly assigned 150 to a new nasal spray and 150 to the current spray. Within one hour, 96 people using the new spray and 84 using the current spray reported relief. The company wants to advertise that the new spray gives relief to a higher proportion of patients.
- (a) Construct and interpret a 95% confidence interval for the difference in relief proportions (new minus current).
- (b) Does the interval support the company's claim?
(a) State: We want to estimate with 95% confidence, where = the true proportion of patients like these who would get relief within one hour with the new spray, and = the true proportion with the current spray.
Plan: Two-sample -interval for a difference between population proportions.
- Randomization: the volunteers were randomly assigned to the two sprays.
- 10%: not needed, because this is a randomized experiment.
- Normality: the observed successes and failures, 96, 54, 84, and 66, are all at least 10.
Do:
Conclude: We are 95% confident that the interval from to captures the true difference (new minus current) between the proportions of patients like these who would get relief within one hour.
(b) No. The interval contains 0, so it's plausible that the two sprays give relief to the same proportion of patients, and the interval does not give convincing evidence that the new spray works for a higher proportion. That isn't proof the sprays work equally well either: plausible values run from the new spray being 3.1 percentage points worse to 19.1 points better.
Common mistakes
- Probability language: "There's a 95% chance is between and ." The 95% describes the method, not one interval.
- Sample instead of population: "We're 95% confident the interval captures ." It always does, since the interval is centered there. The parameter is the difference between the population proportions.
- No direction: not saying which group was subtracted from which, and then misreading the sign.
- Treating 0 in the interval as proof of no difference. Say there is not convincing evidence of a difference.
- Missing context: name both populations (or treatments) and the response variable.
- Overreaching: an experiment on volunteers supports cause and effect, but only for subjects like those in the study. Random samples without random assignment don't support cause and effect.