

3.5 - Setting Up a Test for a Population Proportion
Overview
A confidence interval estimates a parameter. A hypothesis test (also called a significance test) asks a yes-or-no question about it: do the data give convincing evidence against a claimed value? This topic covers setting up the test: choosing the procedure, defining the parameter, writing the hypotheses, and checking conditions. Topics 3.6 and 3.7 finish the test with the -value and the conclusion.
What a hypothesis test does
A hypothesis test is a statistical inference procedure used to make a decision about the value of a population parameter. The logic works like a trial, where a defendant is presumed innocent until the evidence says otherwise:
- Assume a claim about the parameter is true (the null hypothesis).
- Collect data from a random sample.
- Ask: if the null hypothesis were true, how unusual would results like ours be?
- If they'd be very unusual, that's convincing evidence against the null hypothesis. If not, you don't have convincing evidence against it.
For a single population proportion, the appropriate procedure is the one-sample -test for a population proportion.
Defining the parameter
Just like with a confidence interval, define the parameter in context. The definition should reference the population parameter, the response variable, and the population, for example: " = the true proportion of all high school students in the district who ride the bus to school."
The null and alternative hypotheses
- The null hypothesis, , is the statement about a parameter that is assumed to be correct unless there's convincing statistical evidence suggesting otherwise. It's the status quo: no change, no difference, the claim on the label.
- The alternative hypothesis, , is the claim or belief about a parameter for which evidence is being collected. A researcher's claim or suspicion goes in .
Both hypotheses are always about the parameter , never about the statistic . You already know exactly, so there's nothing to test about it. Also, choose the hypotheses from the research question before looking at the data. The sample result never decides the direction of .
Writing the hypotheses
For a one-sample -test for a population proportion, the null hypothesis is
where is the null hypothesized value for the population proportion (a specific number, like 0.25). The alternative hypothesis takes one of three forms:
Alternative | Type | Use it when the question asks whether is... |
one-sided | greater than (more, higher, increased) | |
one-sided | less than (fewer, lower, decreased) | |
two-sided | different from in either direction (changed, differs, not equal) |
The null hypothesis always contains an equality reference (, , or ). Sometimes a null is stated with an inequality, like . In AP Statistics it's still tested at the boundary, . That boundary is the hardest null value to reject: if the data are convincing evidence against , they're even stronger evidence against any value above 0.90. Writing is always acceptable.
Example 1: Writing hypotheses
Write the hypotheses for each situation, and define the parameter.
(a) Last year, 30% of a city's residents rode public transit at least once a week. After a new bus line opened, the city wants to know whether that proportion has increased.
Answer: and , where = the true proportion of all the city's residents who now ride public transit at least once a week.
(b) A cell phone company claims that at least 90% of its customers are satisfied. A consumer group suspects the true proportion is lower.
Answer: (or ) and , where = the true proportion of all the company's customers who are satisfied. The company's claim is the status quo, and the consumer group's suspicion goes in .
(c) A spinner has four equal sections, one of them red. A student suspects the spinner is unbalanced and wants to know whether it lands on red something other than 25% of the time.
Answer: and , where = the true proportion of all spins of this spinner that land on red. "Something other than" points in both directions, so the test is two-sided.
Conditions
A one-sample -test for a population proportion requires three conditions:
- Randomization condition: the data should be collected using a random sample.
- 10% condition: when sampling without replacement, the population size must be at least 10 times the sample size, , where is the population size.
- Normality condition: the expected number of successes, , and the expected number of failures, , are both at least 10.
Why and not ? A test is carried out assuming is true. If , the sampling distribution of (called the null distribution) has
and it's approximately normal when and . That's the distribution your sample result gets compared against. A confidence interval (Topic 3.3) is different: there's no assumed value of , so it uses the observed counts and .
Where setup fits in the four steps
A complete test has the same four steps as an interval: State, Plan, Do, Conclude (Topic 3.7 lists what goes in each). Setting up a test is the first two. State gives the hypotheses, the parameter defined in context, and the significance level . Plan names the procedure and checks each condition in context.
Example 2: Setting up a test (AP-style)
Suppose a school district reports that 25% of its high school students ride the bus to school. A transportation planner thinks the true proportion is higher. She selects a random sample of 200 of the district's 6,500 high school students and finds that 64 of them ride the bus. Set up a significance test: state the hypotheses, define the parameter, identify the procedure, and check the conditions.
State:
where = the true proportion of all high school students in the district who ride the bus to school.
Plan: One-sample -test for a population proportion.
- Randomization: the planner selected a random sample of 200 students.
- 10%: .
- Normality: and .
All three conditions are met. Notice that the normality check uses , not the observed 64 successes. If is true, the null distribution of is approximately normal with mean 0.25 and standard deviation
The sample proportion is .
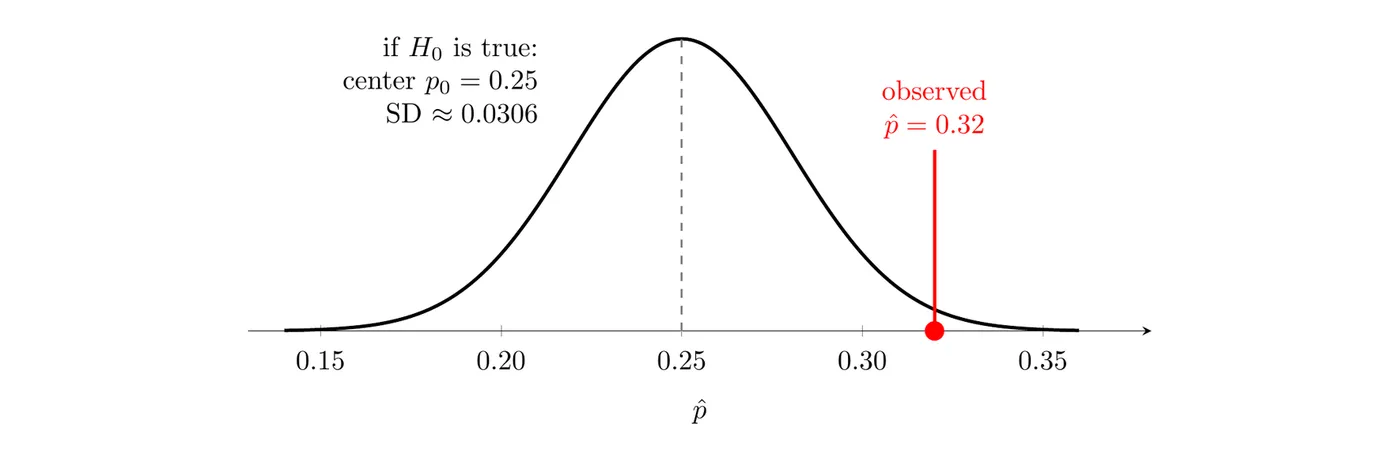
The figure shows where falls if is true: out in the right tail, more than 2 standard deviations above 0.25. Is that unusual enough to reject ? Topic 3.6 explains -values, and Topic 3.7 (Example 3) finishes this test.
Example 3: When the test isn't appropriate
A drug company says that 2% of patients get a headache from its medication. A researcher suspects the rate is higher and takes a random sample of 300 patients. Can she use a one-sample -test?
Step 1: Check normality with .
Answer: No. If is true, only 6 headaches are expected, so the null distribution of would be skewed right and the normal approximation isn't reliable. She needs a larger sample (at least 500 patients, since ), or she could find the probability with the binomial distribution instead (Topic 2.10).
Common mistakes
- Writing hypotheses about the statistic, like . Hypotheses are always about the parameter .
- Letting the data choose the direction. The research question decides , before you see the sample.
- Putting the researcher's claim in . The claim you're looking for evidence of goes in .
- Checking normality with observed counts in a test. For a test, use and .
- Defining without context, or as "the proportion in the sample." Name the population and the response.
- Mismatching the alternative and the question. "More than" means , "less than" means , and "different from" means .