

3.12 - Setting Up a Test for the Difference Between Two Population Proportions
Overview
When a question asks whether two populations (or two treatments) differ in the proportion with some outcome, and wants convincing evidence, you run a two-sample -test for the difference between two population proportions. This topic covers the setup: naming the test, defining the parameters, writing the hypotheses, and checking the conditions. Topic 3.13 does the calculations and the conclusion. On a free-response question, the setup alone is worth several points.
Choosing the test
Use this test when all three of these are true:
- There are two groups: two populations sampled separately, or two treatments in an experiment.
- The response is categorical with two outcomes (yes or no, success or failure), so each group has a proportion.
- The question asks whether there is convincing evidence of a difference (or that one proportion is larger). That's a test. If the question asks you to estimate the size of the difference, use the two-sample -interval from Topic 3.10.
Name it in full: "two-sample -test for the difference between two population proportions." On AP scoring, a vague name like "two-sample -test" or "2-prop test" doesn't earn the point, and calculator syntax like
2-PropZTest doesn't count as a name. Writing the test statistic formula from Topic 3.13 also identifies the test.Situation | Procedure |
One population, estimate | One-sample -interval for a population proportion |
One population, test a claim about | One-sample -test for a population proportion |
Two populations or treatments, estimate | Two-sample -interval for a difference between population proportions |
Two populations or treatments, test for a difference | Two-sample -test for the difference between two population proportions |
More than two groups, or more than two response categories | Chi-square test for homogeneity or independence (Topic 3.14) |
Defining the parameters
The parameters are the two population proportions. A complete definition names three things: that each one is a population (true) proportion, the response variable, and the population (or treatment) in context.
Let = the true proportion of [population 1] who [response], and = the true proportion of [population 2] who [response].
Use subscripts that mean something, like and for City A and City B. For an experiment, describe the treatment and the subjects instead of a population, for example " = the true proportion of patients like those in the study who would book a dental cleaning within 30 days if sent a reminder email." Never put a hat on a parameter: is a sample statistic.
Writing the hypotheses
The null hypothesis says there is no difference between the two population proportions. It can be written two equivalent ways:
The alternative hypothesis comes from the research question. It's one of three:
The question asks whether... | Alternative | Equivalent form |
is smaller than | ||
is larger than | ||
the proportions differ, in either direction |
Look for direction words. "Increase," "higher," and "more likely" point to (with group 1 first); "decrease" and "lower" point to ; "differ," "change," and "is there a difference" point to . Choose the alternative from the question before looking at the data, never from which sample proportion came out bigger.
Why the direction matters: if is true, varies around 0 from sample to sample. The alternative decides which results count as evidence against : differences far below 0, far above 0, or far from 0 in either direction. Those are the shaded regions below.
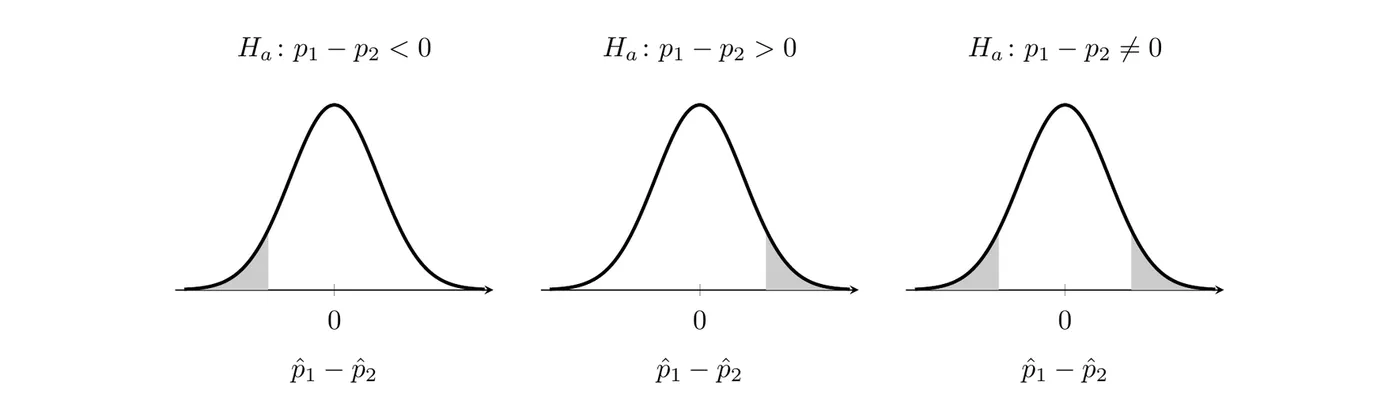
A one-sided alternative looks at one tail. A two-sided alternative looks at both tails, which is why its -value in Topic 3.13 counts both.
Checking conditions
A two-sample -test for the difference between two population proportions requires three conditions. Check each one in context, with numbers.
Randomization condition
The data must come from two independent random samples or a randomized experiment.
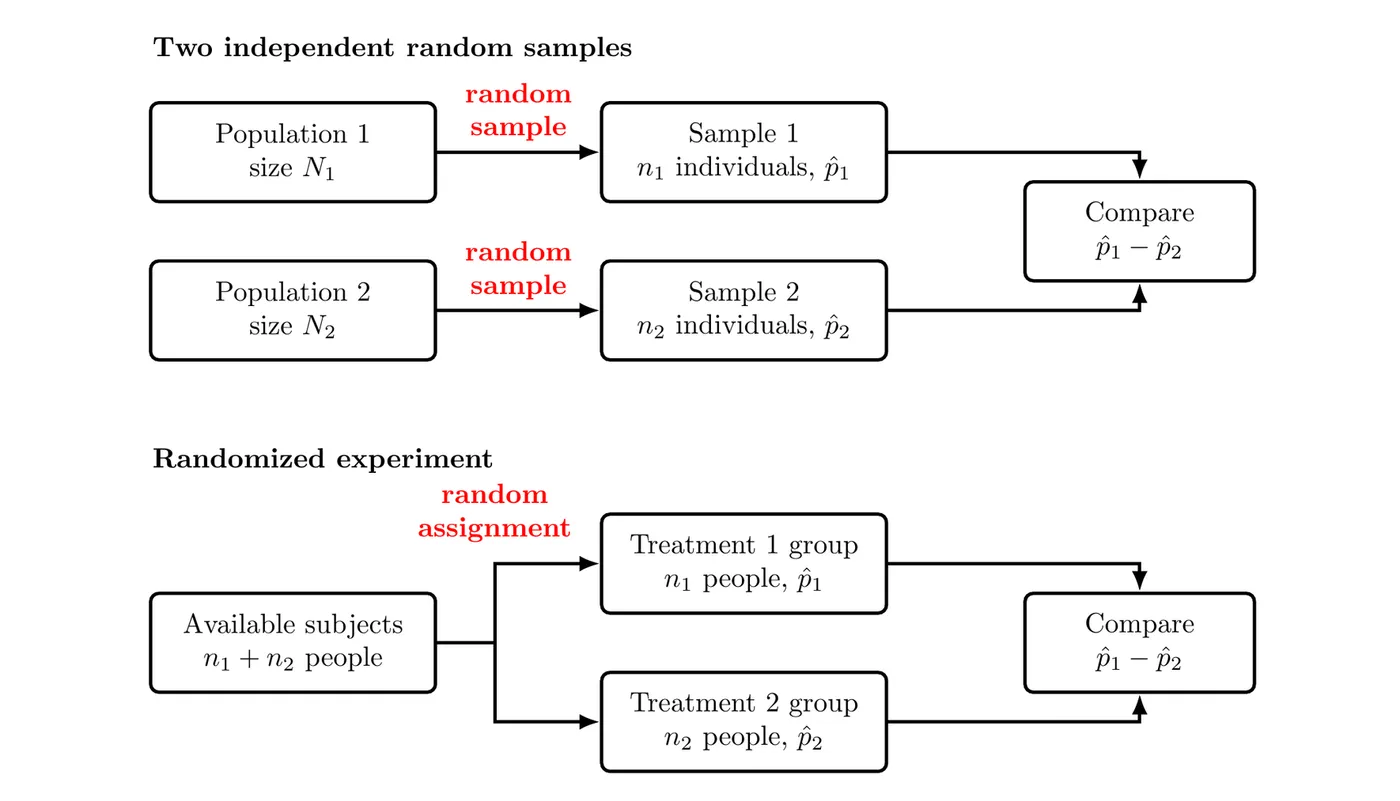
- Independent samples means the two samples are chosen separately, so who lands in one sample has nothing to do with who lands in the other. Random samples from two different cities are independent. Measuring the same people twice is not; that's paired data, which needs a different method.
- Why it matters: randomness is what makes the sampling distribution of predictable. It also sets the scope of the conclusion. Random samples let you generalize to the populations, and random assignment lets you conclude cause and effect.
10% condition
When sampling without replacement, each sample can be at most 10% of its population:
where and are the population sizes. This keeps the observations close enough to independent that the standard deviation formula works. This condition is unnecessary for a randomized experiment, since no one is sampled from a population.
Normality condition (large counts)
The test is carried out assuming is true, and says the two population proportions are equal. So instead of using and separately, combine both samples into one estimate of that common proportion, the combined (pooled) proportion:
Then check that these four counts are all at least 10:
When they are, the sampling distribution of is approximately normal, so a -test works. Two notes:
- The interval in Topic 3.10 checks observed counts ( and so on) because it doesn't assume . The test assumes , so its condition uses . (AP scoring has also accepted observed counts for a test, but the version is never wrong.)
- "" and "by the Central Limit Theorem" are not the normality condition for proportions, and they earn no credit.
Example 1: Electric vehicles in two cities
City A has about 180,000 households and City B has about 240,000. A researcher takes a random sample of 280 households in City A and a separate random sample of 340 households in City B. In City A, 56 of the sampled households own at least one electric vehicle (EV); in City B, 51 do. The researcher wants to know whether the proportion of households that own an EV differs between the two cities. Set up the appropriate test. (Topic 3.13 carries it out.)
State: The question says "differs," with no direction, so the alternative is two-sided.
where = the true proportion of all households in City A that own at least one EV, and = the true proportion of all households in City B that own at least one EV.
Plan: Two-sample -test for the difference between two population proportions. Check the conditions:
- Randomization: the researcher took separate random samples of households from the two cities, so these are two independent random samples.
- 10%: and .
- Normality: first find the combined proportion, then the four counts.
All four counts are at least 10. Every condition is met, so the test is appropriate.
Example 2: Reminder emails and dental cleanings (AP-style)
A dental clinic recruited 360 volunteers who were overdue for a cleaning and randomly assigned 240 of them to get a reminder email and the other 120 to get no reminder. Within 30 days, 108 patients in the email group and 36 in the no-reminder group booked a cleaning. The clinic wants to know whether reminder emails increase the proportion of patients who book a cleaning. State the hypotheses, define the parameters, identify the procedure, and check the conditions.
State: "Increase" gives a one-sided alternative, with email minus no reminder.
where = the true proportion of patients like those in the study who would book a cleaning within 30 days if sent a reminder email, and = the true proportion of patients like these who would book a cleaning within 30 days with no reminder.
Plan: Two-sample -test for the difference between two population proportions. Check the conditions:
- Randomization: patients were randomly assigned to the email and no-reminder groups.
- 10%: not needed, because this is a randomized experiment, not a sample from a population.
- Normality: . The groups have different sizes, so check all four counts: , , , and , all at least 10.
Because the patients volunteered, any conclusion applies to patients like these. Because the reminders were randomly assigned, a significant result would support cause and effect.
Example 3: Fixing a weak setup
A student's setup for Example 2 reads:
Two-sample z-test. , . Conditions: random, , so the CLT applies.
Here's what would lose points, and the fix for each:
- The name is incomplete. Write "two-sample -test for the difference between two population proportions."
- The hypotheses use sample proportions (), and the parameters are never defined. Use and , defined in context.
- "Random" by itself doesn't connect to the study. Say the patients were randomly assigned to the two groups.
- and the CLT aren't the condition for proportions. Show the four counts using , each at least 10.
Common mistakes
- Hypotheses about statistics: writing and in the hypotheses. Hypotheses are always about parameters.
- Picking the direction after seeing the data: the alternative comes from the question, not from which sample proportion is bigger.
- Parameters without context: " = proportion for group 1" is missing the population and the response.
- Mismatched randomization: saying "random assignment" when the data came from random samples, or the other way around. Match the condition to the design, and skip the 10% condition for an experiment.
- Wrong normality check: using , or counts that aren't checked against 10.
- Flipping the order: if is , keep the email group first in every calculation.