

3.7 - Carrying Out a Test for a Population Proportion
Overview
Topic 3.5 set up a test for a population proportion (hypotheses and conditions), and Topic 3.6 explained what a -value means. Now you finish the job: calculate the test statistic and -value, compare the -value to a significance level, and write a conclusion in context. Together, these steps make up the one-sample -test for a population proportion, which shows up on the AP exam in both multiple-choice and free-response questions.
The test statistic
The test statistic for a population proportion is
where is the sample proportion, is the null value from , and is the sample size.
- What it measures: how many standard deviations the sample proportion is from the null value. It matches the general form on the AP formula sheet: standardized test statistic .
- Why is in the denominator: a test assumes is true, so it uses the standard deviation the sampling distribution of would have if . (A confidence interval uses instead, because there's no null value to assume.)
- What the sign tells you: a positive means is above , and a negative means it's below.
When the null hypothesis is true, the -statistic has a standard normal distribution (approximately, once the conditions are met).
The null distribution as a normal model
The null distribution (the distribution of the test statistic when is true) can be approximated by a probability model such as the standard normal distribution. Here's why: when the conditions hold, the sampling distribution of is approximately normal with mean and standard deviation (Topic 3.2). Standardizing turns it into the standard normal distribution, . So once you have , the -value is just an area under the standard normal curve.
Finding the -value
Find the -value from the standard normal distribution, using a table or technology:
- Normal table: the table gives the area to the left of . For a right tail, subtract from 1. For a two-sided test, double the tail area.
normalcdf: on a TI-84,normalcdf(lower, upper, 0, 1)gives the area between two -values. Use-1E99or1E99for a tail.
- The whole test at once: STAT, TESTS,
1-PropZTest. Enter , (the number of successes), , and the direction of . It reports , the -value, and .
If you use the calculator on the AP exam, name the procedure in words ("one-sample -test for a population proportion"). Calculator syntax like
1-PropZTest doesn't count as naming it. Writing the formula with the numbers plugged in is the safest way to show your work.The significance level
The significance level of a test, written , is the probability of rejecting the null hypothesis when it is actually true. It's chosen before the data are collected, either given in the problem or set by the researcher. Common choices are , , and . If a problem doesn't give one, use and say so.
A result is statistically significant at level when its -value is less than or equal to . The comparison between the -value and is what decides it.
Making the decision
A formal decision compares the -value to out loud:
Comparison | Decision | What it means |
-value | Reject | There is convincing statistical evidence for . |
-value | Fail to reject | There is not convincing statistical evidence for . |
A test can reject or fail to reject it, but it can never prove that is true. A lack of evidence for the alternative is not the same as evidence for the null. That's why you write "fail to reject " and never "accept ."
Writing the conclusion
The conclusion is stated in context, in terms of the alternative hypothesis, with non-definitive language ("convincing evidence that," not "proves that"). It names the parameter and the population. Use these templates:
- If -value : "Because the -value of ___ is less than ___, we reject . There is convincing evidence that the true proportion of [population] who [response] is [greater than / less than / different from] ."
- If -value : "Because the -value of ___ is greater than ___, we fail to reject . There is not convincing evidence that the true proportion of [population] who [response] is [greater than / less than / different from] ."
The conclusion is also your answer to the study's investigative question. If the question was "Is the satisfaction rate lower than the company claims?", the test's conclusion is the statistical reasoning behind your yes or no.
The four steps
AP free-response inference questions are scored on these four steps, and every significance test in Units 3 and 4 uses them:
- State: the hypotheses, with the parameter defined in context, and the significance level .
- Plan: name the procedure (here, a one-sample -test for a population proportion) and check each condition in context: randomization, 10%, and normality (Topic 3.5).
- Do: calculate the test statistic and the -value, showing the formula with your numbers plugged in.
- Conclude: compare the -value to , make the decision, and state the conclusion in context, in terms of .
Example 1: Customer satisfaction (AP-style)
A phone company advertises that 80% of its customers are satisfied with their service. A consumer group thinks the true proportion is lower. The group selects a random sample of 400 of the company's more than 50,000 customers and finds that 302 are satisfied. Do the data give convincing evidence at that less than 80% of all the company's customers are satisfied?
State:
where is the true proportion of all the company's customers who are satisfied. Use .
Plan: One-sample -test for a population proportion. Check the conditions:
- Randomization: the data come from a random sample of 400 customers.
- 10%: of all customers, since 10% of 50,000 is 5,000.
- Normality: and .
Do: The sample proportion is .
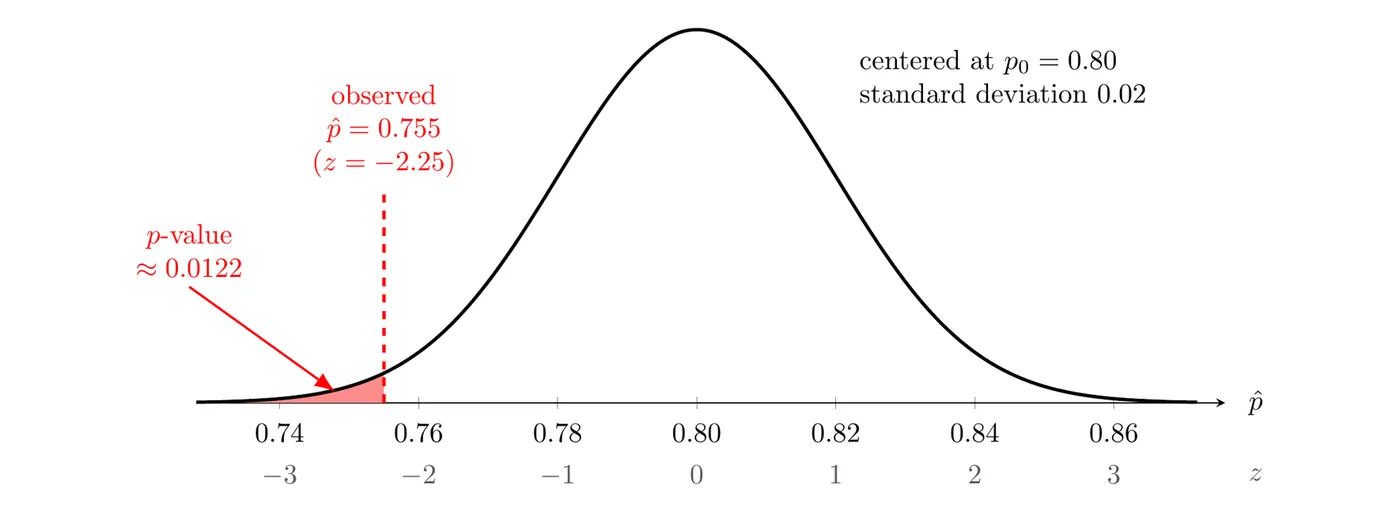
The graph shows the null distribution: the sampling distribution of if 80% of customers were satisfied. The observed is standard deviations below , and the -value is the tiny shaded area to its left.
Conclude: Because the -value of is less than , we reject . There is convincing evidence that the true proportion of all the company's customers who are satisfied is less than .
Calculator check:
1-PropZTest with , , , and gives and .Example 2: Has support changed? (two-sided)
Last year, 45% of the residents of a large city supported building a new stadium. This year, a reporter wants to know whether support has changed. She surveys a random sample of 250 residents, and 122 of them support the stadium. Use .
State:
where is the true proportion of all the city's residents who support the new stadium this year. Use . The alternative is two-sided because the question asks whether support has changed, in either direction.
Plan: One-sample -test for a population proportion.
- Randomization: random sample of 250 residents.
- 10%: 250 is less than 10% of the residents of a large city.
- Normality: and .
Do: .
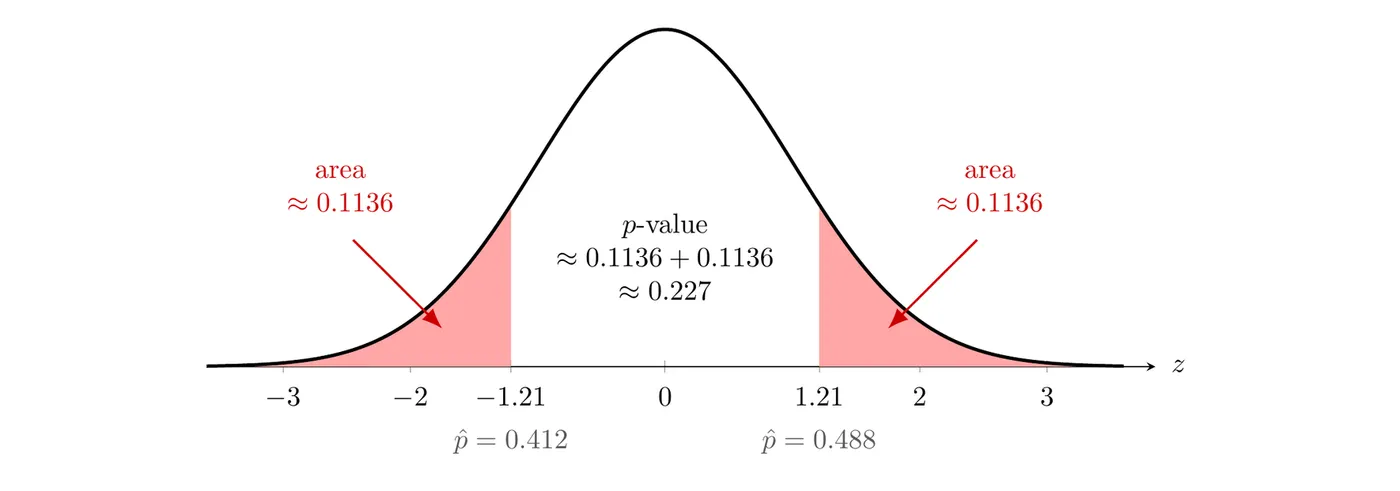
Conclude: Because the -value of is greater than , we fail to reject . There is not convincing evidence that the true proportion of all the city's residents who support the new stadium has changed from .
This does not show that support is still exactly 45%. A sample proportion of is consistent with , but it's also consistent with or . (A 95% confidence interval from this sample, about to , contains all three.)
Example 3: Finishing the bus test from Topic 3.5
In Topic 3.5, Example 2, a transportation planner set up a test about a school district's claim that 25% of its high school students ride the bus. In her random sample of 200 of the district's 6,500 high school students, 64 ride the bus. No significance level was given, so use .
State: and , where is the true proportion of all high school students in the district who ride the bus to school, with .
Plan: One-sample -test for a population proportion. Topic 3.5 checked the conditions: a random sample, , and and , both at least 10.
Do: .
Conclude: Because the -value of is less than , we reject . There is convincing evidence that the true proportion of all high school students in the district who ride the bus to school is greater than .
Common mistakes
- Using in the standard deviation of the test statistic. A test assumes , so it uses .
- Writing hypotheses or conclusions about . Hypotheses and conclusions are about the parameter , the true proportion for the whole population.
- Saying "accept " or "this proves ." Use "fail to reject " and "convincing evidence."
- Comparing to . Compare the -value to .
- A conclusion with no context or no link to the -value. Say how the -value compares to , then state the conclusion about the population in the problem's words.
- Picking after seeing the -value. The significance level is set before the data are collected.