

3.14 - Setting Up a Chi-Square Test for Homogeneity or Independence
Overview
The -tests in topics 3.12 and 3.13 handle two groups and a yes-or-no response. For more groups or more categories, like three cities and three ways to commute, the data go in a two-way table of counts and you use a chi-square test. This topic sets the tests up, and Topic 3.15 carries them out.
What the chi-square statistic measures
Every chi-square test compares two sets of counts:
- Observed counts: what actually happened in the data.
- Expected counts: what you'd expect in each cell if were true. For a two-way table, expected count = (row total)(column total) / (table total). Topic 3.15 explains why.
The chi-square statistic measures the distance between the observed and expected counts, relative to the expected counts:
The sum runs over every cell of the table. Each part has a job:
- Squaring the difference makes every cell's contribution positive, so cells above and below their expected counts don't cancel out.
- Dividing by the expected count puts each gap in proportion. Being off by 10 when you expected 20 is a big miss: . Being off by 10 when you expected 500 is tiny: .
If every observed count matched its expected count exactly, would be 0. The farther the data are from what predicts, the larger gets, and the stronger the evidence against .
Chi-square distributions
When is true, the statistic varies from sample to sample according to a chi-square distribution. There's a whole family of these density curves, one for each number of degrees of freedom (df). What they have in common:
- They take only positive values, because is a sum of squares divided by positive counts.
- They are skewed right.
- As df increases, the skew becomes less pronounced: the peak moves right, the curve spreads out, and the shape looks more symmetric. (The mean of a chi-square distribution equals its df.)
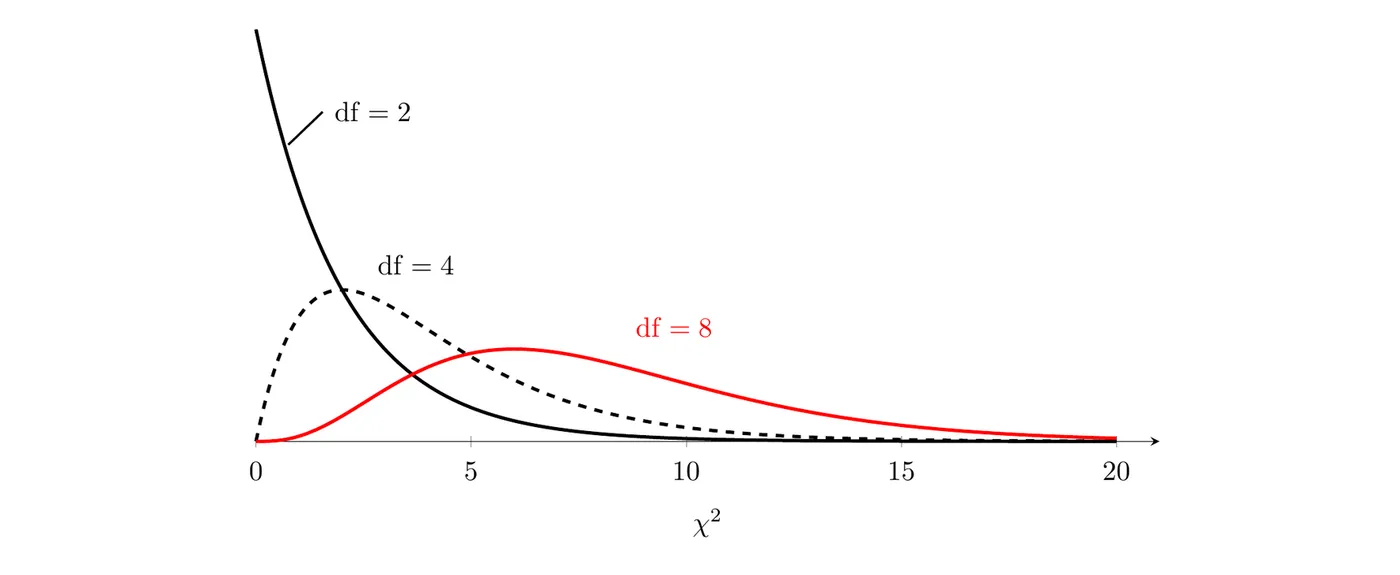
The figure shows df = 2, 4, and 8. Large values of are the evidence against , so the -value is always a right-tail area. Topic 3.15 shows how to find df for a two-way table.
Choosing the test: homogeneity or independence
Both tests use a two-way table and identical arithmetic. What differs is how the data were collected and what question is asked.
Chi-square test for homogeneity
Use it to decide whether the distribution of one categorical variable differs across two or more populations (or treatments). The data come from a separate random sample from each population, or from the treatment groups of a randomized experiment, so the researcher decides how many individuals are in each group.
When you name the test, reference the categorical variable and the populations in context, for example: "a chi-square test for homogeneity comparing the distributions of commuting method for adults in City A, City B, and City C."
Chi-square test for independence
Use it to decide whether two categorical variables are associated in one population. The data come from a single random sample, and each individual is classified on both variables (one gives the rows of the table, the other the columns).
When you name the test, reference both categorical variables and the population in context, for example: "a chi-square test for independence between grade level and number of clubs for students at this high school."
How to tell them apart
Feature | Homogeneity | Independence |
Samples or groups | Two or more, one per population or treatment | One |
Categorical variables | One, compared across the groups | Two, both recorded for each individual |
Question | Are the distributions different across the groups? | Are the two variables associated? |
How the data were collected | Independent random samples or a randomized experiment | A single random sample |
Quick check: ask how many samples were taken. Several samples and one variable means homogeneity. One sample and two variables means independence.
Writing the hypotheses
Chi-square hypotheses are written in words. They never have a direction, because the test only asks whether a difference or an association exists.
Homogeneity
- : There is no difference in the distributions of [categorical variable] across [the populations or treatments].
- : There is a difference in the distributions of [categorical variable] across [the populations or treatments].
Independence
- : There is no association between [variable 1] and [variable 2] in [the population]. Equivalently, the two variables are independent in [the population].
- : There is an association between [variable 1] and [variable 2] in [the population]. Equivalently, the two variables are not independent in [the population].
Always name the population. "Grade level and club participation are independent" is incomplete; "...for students at this high school" finishes it.
Checking conditions
A chi-square test for homogeneity or independence requires three conditions.
Randomization condition
- Test for independence: the data come from a random sample.
- Test for homogeneity: the data come from independent random samples or a randomized experiment.
10% condition
When sampling without replacement, the sample size must be at most 10% of the population: . For homogeneity, check each sample against its own population. This condition is unnecessary when the data come from a randomized experiment.
Expected counts condition
All expected counts should be greater than 5. This is what makes a chi-square distribution a good model for the statistic. Check the expected counts, not the observed ones; an observed count can be small (even 0). The cleanest way to show it: report the smallest expected count, which always sits where the smallest row total meets the smallest column total. (You'll also see this condition written as "at least 5"; showing the smallest expected count covers you either way.)
Example 1: Homogeneity or independence?
Identify the appropriate chi-square test for each study.
- (a) A researcher takes separate random samples of adults from City A (120 adults), City B (150), and City C (180), and records each person's main way of commuting: car, public transit, or bike or walk.
- (b) A random sample of 200 students at a high school are each asked their grade level and how many clubs they're in (none, one, or two or more).
- (c) 240 volunteers with insomnia are randomly assigned to use a sleep app, take melatonin, or take a placebo. After a month, each rates their sleep as worse, the same, or better.
(a) Homogeneity. Three separate samples and one variable (commuting method). The question is whether the distribution of commuting method differs across the three cities.
(b) Independence. One sample, with two variables recorded for each student. The question is whether grade level and number of clubs are associated.
(c) Homogeneity. A randomized experiment with three treatment groups and one categorical response (the sleep rating). It compares the distributions of the response across the treatments.
Example 2: Setting up a test for homogeneity
Here are the results for study (a). Each city has well over 200,000 adults. Set up a test of whether the distribution of commuting method differs among the three cities.
City | Car | Public transit | Bike or walk | Total |
City A | 78 | 30 | 12 | 120 |
City B | 84 | 48 | 18 | 150 |
City C | 129 | 24 | 27 | 180 |
Total | 291 | 102 | 57 | 450 |
State:
- : There is no difference in the distributions of main commuting method (car, public transit, bike or walk) for adults in City A, City B, and City C.
- : There is a difference in the distributions of main commuting method for adults in City A, City B, and City C.
Plan: chi-square test for homogeneity, comparing the distributions of main commuting method for adults in City A, City B, and City C. Check the conditions:
- Randomization: independent random samples of adults were taken from the three cities.
- 10%: 120, 150, and 180 are each less than 10% of the more than 200,000 adults in each city.
- Expected counts: the smallest row total is 120 (City A) and the smallest column total is 57 (bike or walk), so the smallest expected count is
The smallest expected count is greater than 5, so all of them are, and all three conditions are met. Topic 3.15 finds every expected count and finishes this test.
Example 3: Setting up a test for independence (AP-style)
A high school has 2,400 students. A random sample of 200 of them gave these counts for grade level and number of clubs. Name the appropriate test, state the hypotheses, and check the conditions.
Grade | None | One | Two or more | Total |
9 | 24 | 19 | 9 | 52 |
10 | 20 | 20 | 10 | 50 |
11 | 16 | 20 | 12 | 48 |
12 | 13 | 21 | 16 | 50 |
Total | 73 | 80 | 47 | 200 |
State:
- : There is no association between grade level and number of clubs for students at this high school.
- : There is an association between grade level and number of clubs for students at this high school.
Plan: chi-square test for independence between grade level and number of clubs for students at this high school. It's independence because there's one random sample with two variables recorded for each student. Check the conditions:
- Randomization: the 200 students are a random sample of the school's students.
- 10%: .
- Expected counts: the smallest row total (48, grade 11) and the smallest column total (47, two or more) give the smallest expected count:
Every expected count is at least 11.28, which is greater than 5. All three conditions are met, so the test is appropriate.
Common mistakes
- Mixing up the two tests: decide by the design (how many samples, how many variables), not by the shape of the table.
- Checking observed counts instead of expected counts for the expected counts condition.
- Using percentages or proportions in the table. Chi-square tests need counts.
- Writing hypotheses with a direction or with symbols like . Chi-square hypotheses are in words, with no direction.
- Leaving the population out of the hypotheses.
- Describing chi-square distributions as symmetric, or saying can be negative. They're skewed right and never negative.