

3.9 - Sampling Distributions for the Difference Between Sample Proportions
Overview
Many statistical questions compare two groups. Do more seniors than juniors have a driver's license? Does a new treatment help more patients than the old one? To answer questions like these, we look at the difference between two sample proportions, . This topic describes how that difference varies from sample to sample, which is its sampling distribution. It's the foundation for the two-sample confidence intervals and tests in topics 3.10 to 3.13.
The setup
There are two populations, each with its own proportion of successes. Take a random sample from each, independently, and find each sample proportion. The statistic is the difference . If you repeated this many times, the differences would form a distribution: the sampling distribution of .
Population 1 | Population 2 | |
Population proportion (parameter) | ||
Sample size | ||
Sample proportion (statistic) |
Which group is "1" is your choice. Just say which one it is and keep the same order the whole way through.
Mean and standard deviation
For two independent populations with proportions and , when the sampled values are independent, the sampling distribution of has mean and standard deviation
Why the mean is the true difference
Each sample proportion is an unbiased estimator: and (Topic 3.2). The mean of a difference is the difference of the means, so is an unbiased estimator of . On average, it hits the true difference.
Why the variances add
When you combine two independent random quantities, by adding or subtracting, their variances (squared standard deviations) add. That sounds odd for a difference, but think about it this way: wobbles from sample to sample, and so does . Subtracting one from the other doesn't cancel the wobble. Both sources of variability end up in the difference, so it varies more than either proportion alone.
Each sample proportion has variance (Topic 3.2), so
Take the square root to get the standard deviation. Add the variances, not the standard deviations.
Conditions
Independence: randomization and 10%
When sampling without replacement, two conditions must be met:
- Randomization condition: the data should be collected using two independent random samples, one from each population.
- 10% condition: each sample size must be at most 10% of its population size: and , where and are the population sizes.
If the data come from an experiment, they only need to meet the randomization condition: the treatments must be randomly assigned to the experimental units. There's no 10% condition, because the units weren't sampled from a larger population.
Normality condition
The sampling distribution of is approximately normal when both samples are large enough. The normality condition checks that the expected numbers of successes and failures in both samples are at least 10:
These use the true proportions and , because in this topic they're known (or assumed). In Topic 3.10, where the 's are unknown, you'll check observed counts instead.
Interpreting in context
Interpret the mean, standard deviation, and probabilities in the context of the two specific populations, and say which way you subtracted:
- Mean: "In repeated random samples, the difference in sample proportions ([group 1] minus [group 2]) who [response] averages []."
- Standard deviation: "The difference in sample proportions ([group 1] minus [group 2]) who [response] typically varies by about [] from the true difference of [] in repeated random samples."
Say "the difference in sample proportions" instead of "it." The AP exam expects you to make clear that you mean the sampling distribution of the statistic, not the population or a single sample.
Example 1: Driver's licenses
Suppose that in a large state, 60% of all high school seniors and 50% of all high school juniors have a driver's license. A researcher takes a random sample of 100 seniors and a separate, independent random sample of 120 juniors. Let be the difference in the sample proportions with a license (seniors minus juniors).
(a) Find and interpret the mean of the sampling distribution of . (b) Find and interpret its standard deviation. (c) Check that the sampling distribution is approximately normal.
(a)
In repeated random samples like these, the difference in the sample proportions of seniors and juniors with a license (seniors minus juniors) averages .
(b)
In repeated random samples, the difference in the sample proportions of seniors and juniors with a license typically varies by about from the true difference of .
(c) Randomization: the data come from two independent random samples. 10%: a large state has far more than 1,000 seniors and 1,200 juniors, so each sample is less than 10% of its population. Normality: , , , and are all at least 10. So the sampling distribution of is approximately normal.
Example 2: How likely is a misleading sample? (AP-style)
In the setting of Example 1, find the probability that the samples show juniors with a license at the same rate as seniors or higher. That is, find .
Step 1: Describe the distribution. From Example 1, is approximately normal with mean and standard deviation .
Step 2: Standardize.
Step 3: Find the area.
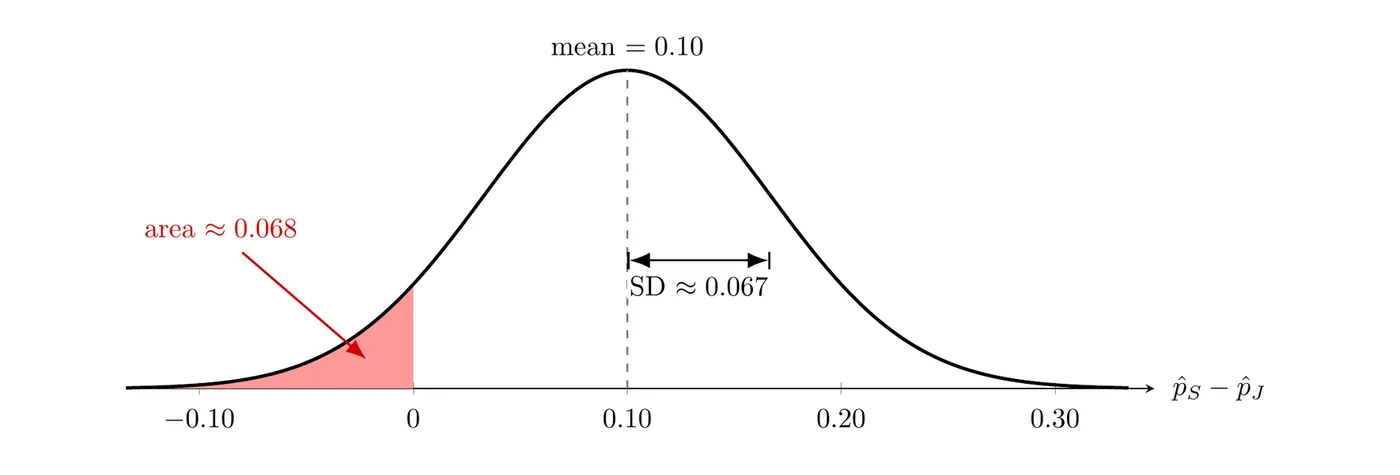
Answer: There's about a probability that the sample proportion of juniors with a license is greater than or equal to the sample proportion of seniors, even though seniors really have the higher rate. That's about 1 in every 15 pairs of samples pointing the wrong way, which is why we need inference before we trust a difference between two samples.
On a TI-84:
normalcdf(-1E99, 0, 0.10, 0.06696) gives about .Common mistakes
- Adding the standard deviations. Add the variances, then take the square root.
- Subtracting the variances because the statistic is a difference. Variances add whether you add or subtract independent quantities.
- Checking large counts for only one sample. All four counts, successes and failures in both samples, must be at least 10.
- Using the 10% condition for an experiment. Experiments need random assignment instead; the 10% condition is for sampling without replacement.
- Interpreting without both populations or the order of subtraction. "The difference varies by about " leaves out who is being compared and which way.