

3.4 - Justifying a Claim Based on a Confidence Interval for a Population Proportion
Overview
Building a confidence interval is half the job. The other half is explaining what it means: interpreting the interval, interpreting the confidence level, and using the interval to decide whether the data back up a claim. This topic also covers how the confidence level and the sample size change an interval's width. These interpretations come up all the time on the AP exam, and precise wording matters.
An interval can miss
A confidence interval for a population proportion is calculated from one sample. A different random sample would give a different and a different interval. Some of those intervals contain the true value of , and some don't. For any one interval, you can't know which kind you have, because you don't know . That's why we say we're "confident," not "certain."
What the confidence level means
The confidence level describes the method, not one particular interval:
In repeated random sampling with the same sample size, approximately of the confidence intervals calculated will capture the population proportion.
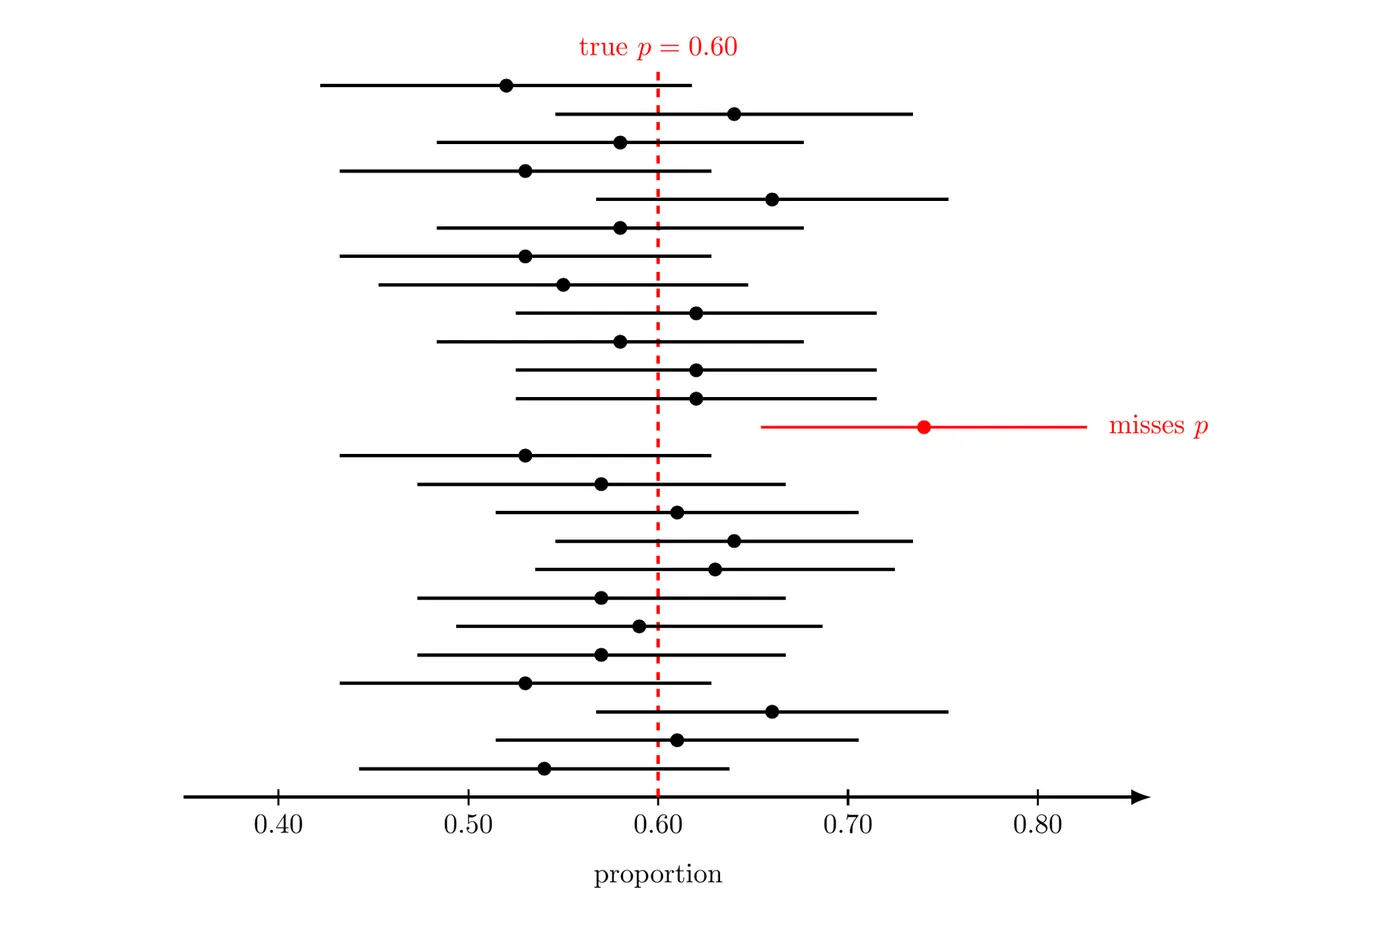
The figure shows 25 random samples of size from a population where the true proportion is , each with its 95% confidence interval. Every interval is centered at its own (the dot). In this simulation, 24 of the 25 intervals (96%) capture , and one (in red) misses it. In the long run, about 95% of intervals built this way capture .
So "95% confident" means we used a method that captures the true proportion in about 95% of all possible samples.
Interpreting a confidence interval
When you interpret a confidence interval for a population proportion, use this template:
We are confident that the interval from to captures the true proportion of [population] who [response].
The interpretation has to refer to the parameter with details about the population, in the context of the study. Compare these statements about the rail survey in Example 1 below:
Statement | Correct? |
"We are 95% confident that the interval from 0.552 to 0.614 captures the true proportion of all adults in the state who support the rail line." | Yes |
"There is a 95% probability that is between 0.552 and 0.614." | No. is a fixed number, so this interval either contains it or doesn't. |
"95% of the adults in the state support the rail line." | No. The 95% describes the method, not the people. |
"We are 95% confident that the sample proportion is between 0.552 and 0.614." | No. We know exactly. The interval estimates . |
"95% of all samples will have a between 0.552 and 0.614." | No. Other samples give other intervals, centered at their own . |
Keep the two interpretations separate:
Interpreting the interval | Interpreting the confidence level | |
What it's about | This one interval | The method, over many samples |
Template | "We are confident that the interval from to captures the true proportion of ..." | "If we took many random samples of size and built a interval from each, about of them would capture the true proportion of ..." |
Using an interval to justify a claim
A confidence interval for a population proportion gives a range of plausible values for , and that range can serve as convincing evidence for or against a claim about :
- If the claimed value is outside the interval, it's not a plausible value, and the interval gives convincing evidence against the claim.
- If the claimed value is inside the interval, the claim is plausible, so the interval doesn't give convincing evidence against it. It doesn't prove the claim either, since many other values are plausible too.
- If a claim says is greater than (or less than) some value, and the entire interval is above (or below) that value, the interval gives convincing evidence for the claim.
Example 1: Interpreting and using an interval (AP-style)
A transportation agency surveyed a random sample of 1,000 adults in a state, and 583 supported building a high-speed rail line. The conditions are met, and a 95% confidence interval for the proportion of all adults in the state who support the rail line is .
(a) Interpret the interval.
(b) Interpret the confidence level.
(c) A state senator says that a majority of the state's adults support the rail line. Does the interval support her claim?
(d) A newspaper reported that 60% of the state's adults support the rail line. Does the interval give convincing evidence that the newspaper is wrong?
(a) We are 95% confident that the interval from 0.552 to 0.614 captures the true proportion of all adults in the state who support building the high-speed rail line.
(b) If the agency took many random samples of 1,000 adults from the state and built a 95% confidence interval from each one, about 95% of those intervals would capture the true proportion of all adults in the state who support the rail line.
(c) Yes. Every value in the interval is greater than 0.5, so every plausible value of the true proportion is a majority. The interval gives convincing evidence that more than half of the state's adults support the rail line.
(d) No. The value 0.60 is inside the interval, so it's a plausible value for the true proportion. The interval doesn't give convincing evidence that the newspaper is wrong. It doesn't prove the newspaper right either, since values like 0.57 and 0.61 are plausible too.
Example 2: A claim outside the interval
Suppose a large university claims that 80% of its graduates find a job in their field within a year. A reporter takes a random sample of 300 of the university's more than 40,000 graduates from the past five years and finds that 222 of them found a job in their field within a year. Does a 95% confidence interval give convincing evidence against the university's claim?
Step 1: Check the conditions. The sample is random, , and there are successes and failures, both at least 10.
Step 2: Build the interval.
Step 3: Compare the claim to the interval.
Answer: Yes. The claimed value 0.80 is not in the interval, so it's not a plausible value for the true proportion of the university's graduates who find a job in their field within a year. Since the whole interval is below 0.80, the interval gives convincing evidence that the true proportion is less than 80%.
How confidence level and sample size affect the interval
Raising the confidence level
For a given sample, increasing the confidence level makes:
- the critical value increase,
- the margin of error increase, and
- the width of the confidence interval increase.
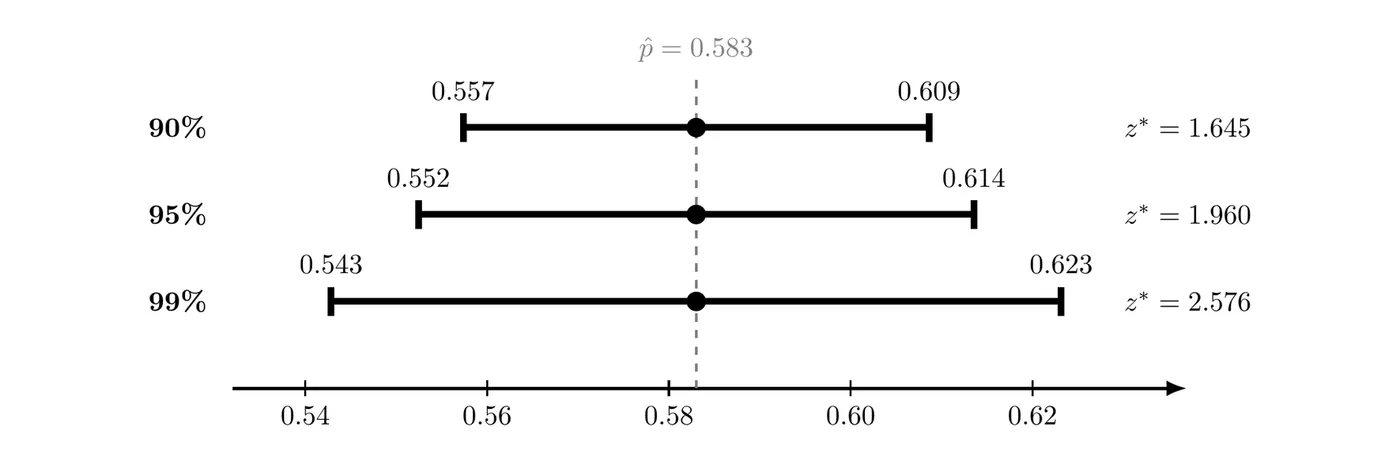
The figure uses the rail survey (, ). The standard error stays at about 0.0156 in every row, and only changes, so the margin of error grows from 0.026 (90%) to 0.031 (95%) to 0.040 (99%). That's the tradeoff: to be more confident, you have to accept a wider, less precise range.
Increasing the sample size
Increasing the sample size decreases the standard error, since is in the denominator of . So when all other things stay the same, the width of the interval tends to decrease as the sample size increases. ("Tends to," because a new sample also brings a new .) For a given confidence level, the width is approximately proportional to :
- Multiplying by 4 cuts the width about in half.
- Multiplying by 9 cuts the width to about one third.
Sample size | 95% margin of error when |
100 | 0.0980 |
400 | 0.0490 |
1,600 | 0.0245 |
Example 3: Cutting the margin of error in half
The rail survey had a 95% margin of error of about 0.031 with . About how many adults would the agency need to survey to cut the margin of error in half, keeping 95% confidence?
Answer: The margin of error is proportional to , so halving it takes 4 times the sample size: about adults. Check, assuming a similar :
That's about half of 0.031, as expected.
Summary of the relationships
Change (all else the same) | Standard error | Margin of error | Interval width | |
Higher confidence level | increases | no change | increases | wider |
Lower confidence level | decreases | no change | decreases | narrower |
Larger sample size | no change | decreases | decreases | narrower |
Smaller sample size | no change | increases | increases | wider |
Common mistakes
- Saying "there's a 95% probability that is in the interval." Say "we are 95% confident."
- Interpreting the interval as being about the sample. The interval estimates the population parameter , not .
- Leaving out the population or the response. "The true proportion" alone isn't enough. Say the true proportion of whom, doing what.
- Treating a value inside the interval as proven. Inside means plausible, not confirmed.
- Thinking a larger sample raises the confidence level. Sample size changes the width. The confidence level is chosen by the researcher.
- Forgetting what the margin of error covers. It only accounts for sampling variability. It doesn't fix bias from undercoverage, nonresponse, or poorly worded questions (Topic 1.12).